The boy who cried wolf about an emerging markets sovereign and corporate debt crisis
These are good times for all those who’ve been crying wolf about market crashes and economic crises for the past couple of decades. It just took two decades, but it seems like most of those apocalyptic predictions are partially starting to come true. The Weimar Republic people had been crying wolf about inflation since 2008. It only took 14 short years, but they were finally proved right. They were heard whispering, “I told you so.” They couldn’t shout because their throats had gone hoarse from crying wolf for 1.4 decades.
The “a sovereign debt crisis is coming” people have been crying wolf for longer, but a crisis never came. But it finally looks like their time is about to come. For the past few months, I’ve been listening to the who’s who of macro. A recurring theme among these people is the looming sovereign and corporate debt crisis in emerging and advanced countries. I’m reliably told by certain genius macro commentators this is just a few months away. They were also generous enough to suggest I sell everything, invest in gold, buy an underground bunker and stock up on canned food and ammo. Very nice people.
Now that the US Fed raising rates, the sovereign debt crisis chatter has been getting louder—especially in emerging markets. The World Bank and IMF have joined the chorus.
So, is there a looming emerging markets sovereign debt crisis? I had no clue. So, over the past couple of weeks, I’ve been googling to get a sense of the situation in emerging markets is. This post is a collection of some interesting things I came across. This isn’t meant to be a definitive post. It’s just a 10,375-foot view of emerging markets.
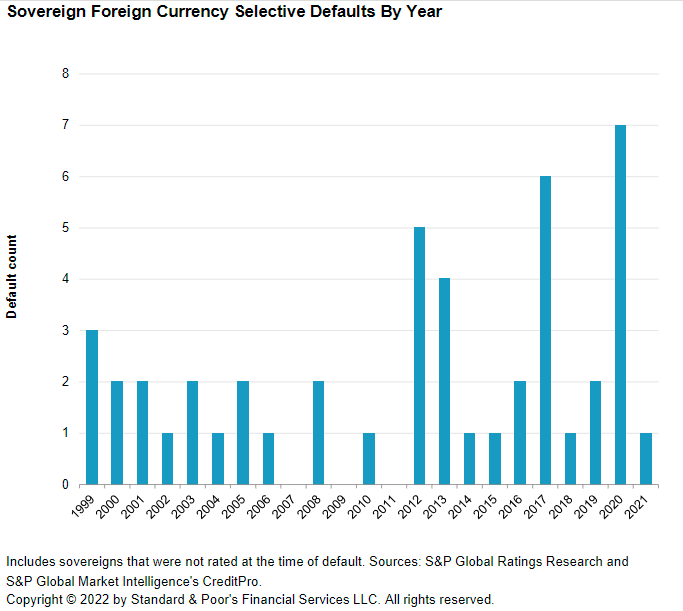
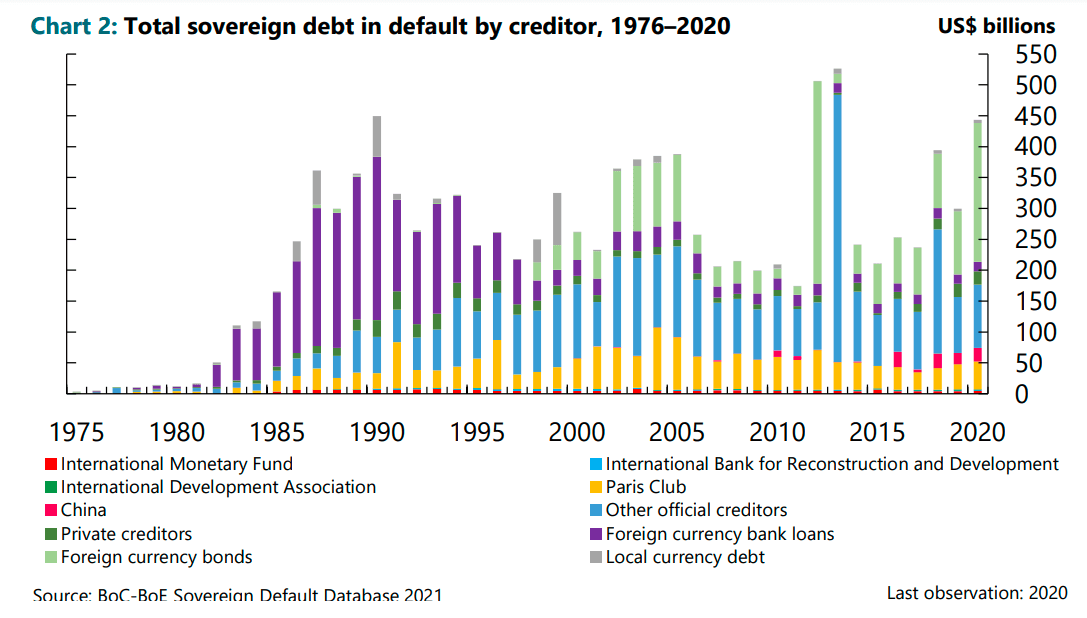
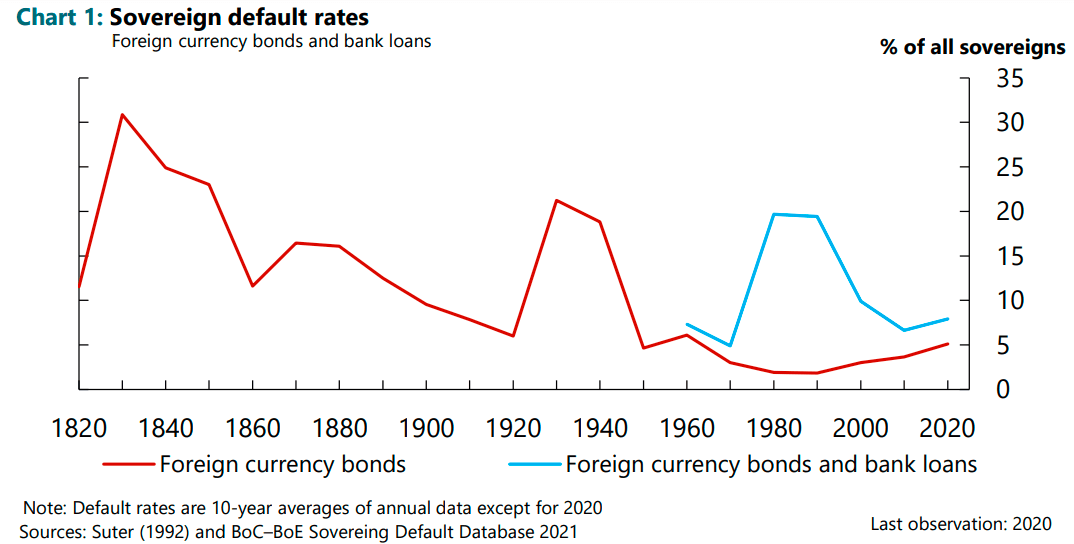
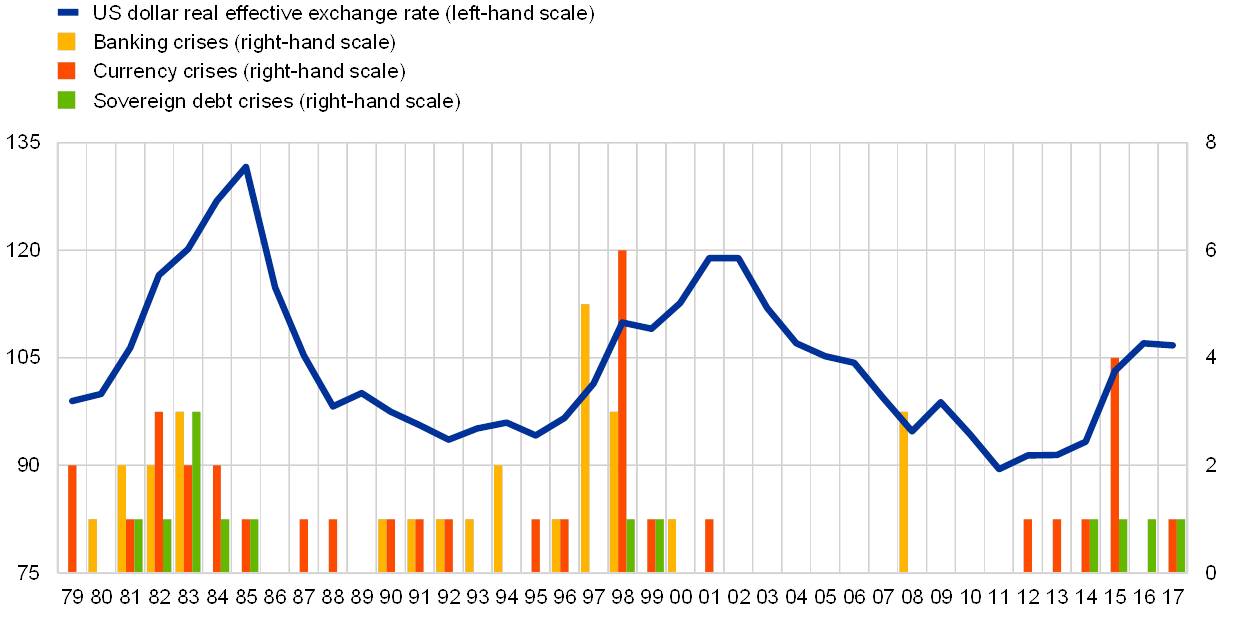
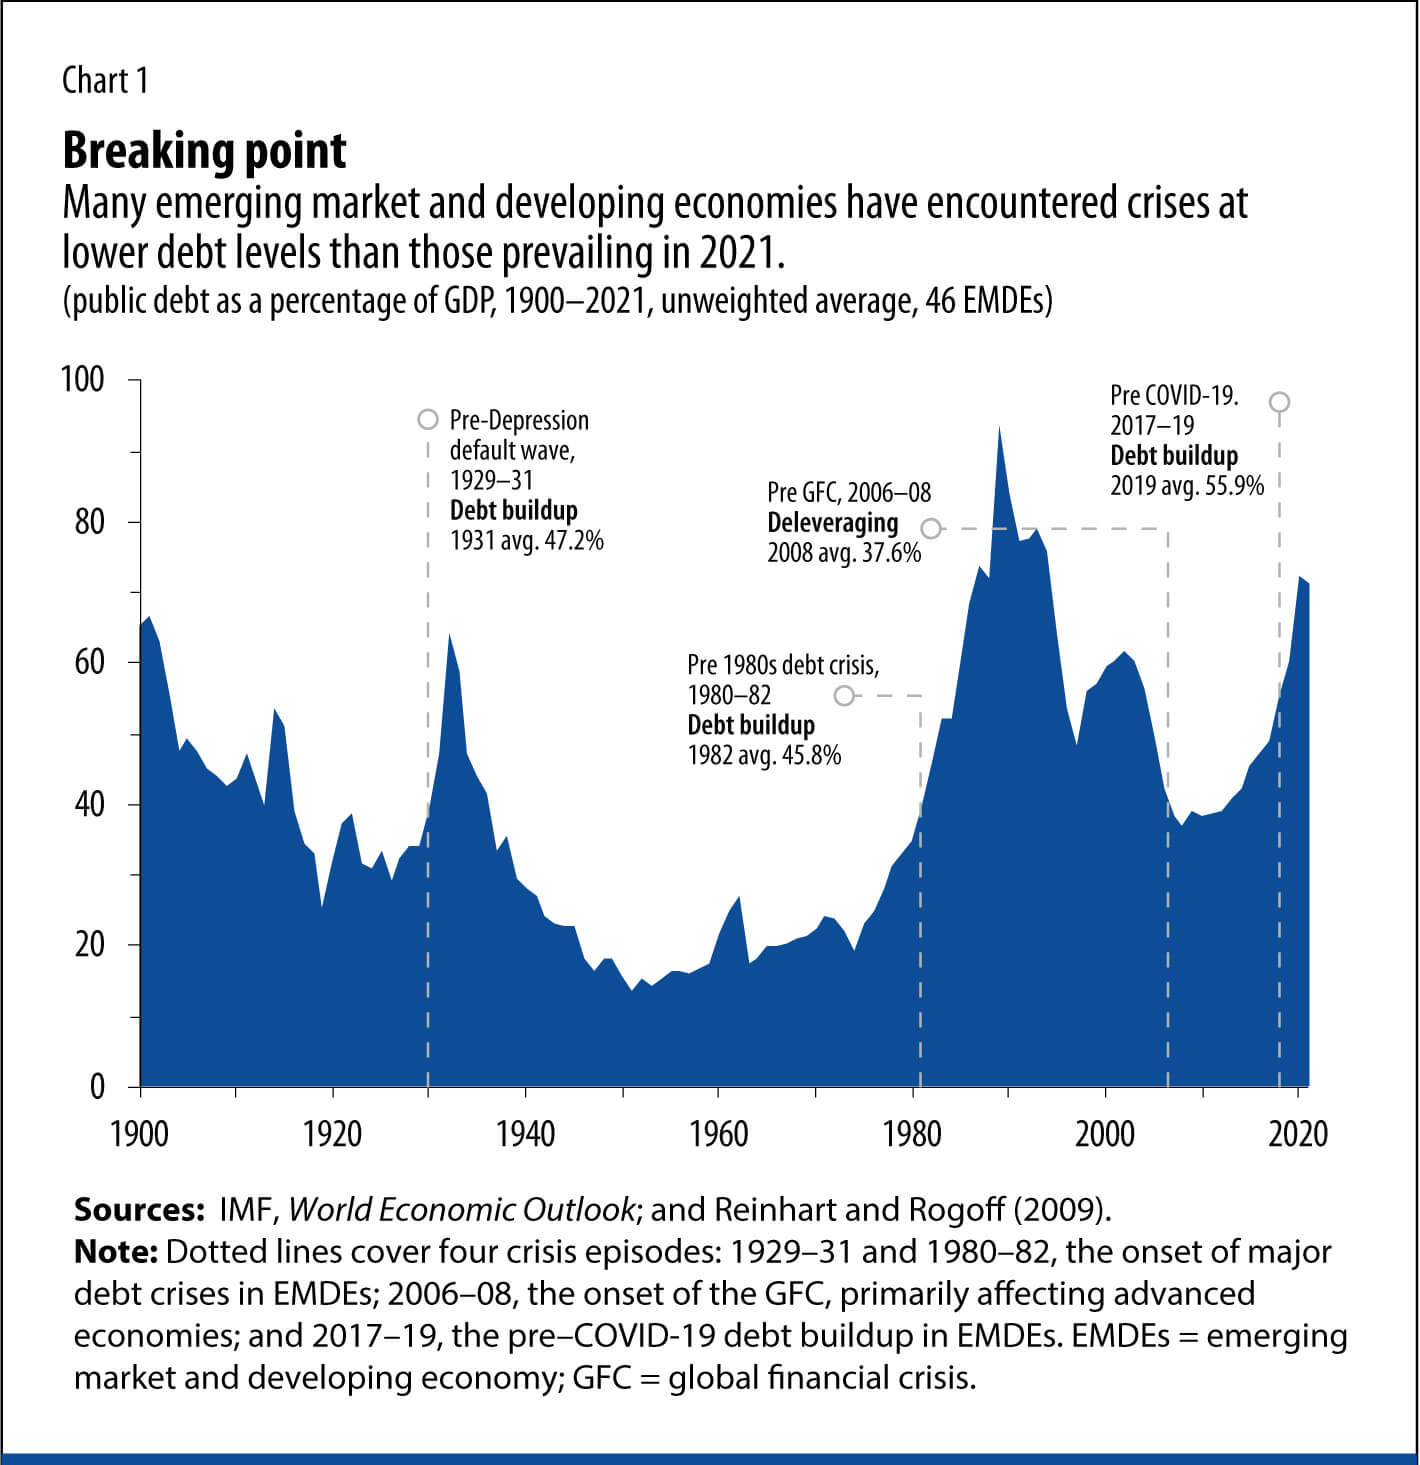
But before that, how often do sovereigns default? Here’s a history of global sovereign and corporate defaults. Over the long arc of history, sovereign defaults have fallen sharply:
Defaults had the biggest global impact in the 1980s, reaching US$450 billion, or 6.1 percent of world public debt, by 1990. The scale of defaults has fallen substantially since then. Over the past decade, between 0.3 and 0.9 percent of world public debt has been in default. In 2020, the amount was estimated at 0.5 percent. Total sovereign debt in default increased by 48 percent in 2020, considerably outpacing the 13 percent increase in gross world public debt
<ul class="wp-block-jetpack-slideshow_swiper-wrapper swiper-wrapper">
<li class="wp-block-jetpack-slideshow_slide swiper-slide">
<img loading="lazy" decoding="async" width="683" height="611" alt="" class="wp-block-jetpack-slideshow_image wp-image-316" data-id="316" src="https://www.bebhuvan.com/wp-content/uploads/2022/05/Sovereign-Foreign-Currency-Selective-Defaults-By-Year.png" srcset="https://www.bebhuvan.com/wp-content/uploads/2022/05/Sovereign-Foreign-Currency-Selective-Defaults-By-Year.png 683w, https://www.bebhuvan.com/wp-content/uploads/2022/05/Sovereign-Foreign-Currency-Selective-Defaults-By-Year-300x268.png 300w" sizes="auto, (max-width: 683px) 100vw, 683px" />
</li>
<li class="wp-block-jetpack-slideshow_slide swiper-slide">
<img loading="lazy" decoding="async" width="1024" height="582" alt="" class="wp-block-jetpack-slideshow_image wp-image-253" data-id="253" src="https://www.bebhuvan.com/wp-content/uploads/2022/04/sovereign-debt-in-default-by-creditor-1024x582.png" srcset="https://www.bebhuvan.com/wp-content/uploads/2022/04/sovereign-debt-in-default-by-creditor-1024x582.png 1024w, https://www.bebhuvan.com/wp-content/uploads/2022/04/sovereign-debt-in-default-by-creditor-300x171.png 300w, https://www.bebhuvan.com/wp-content/uploads/2022/04/sovereign-debt-in-default-by-creditor-768x437.png 768w, https://www.bebhuvan.com/wp-content/uploads/2022/04/sovereign-debt-in-default-by-creditor.png 1087w" sizes="auto, (max-width: 1024px) 100vw, 1024px" />
</li>
<li class="wp-block-jetpack-slideshow_slide swiper-slide">
<img loading="lazy" decoding="async" width="1024" height="519" alt="" class="wp-block-jetpack-slideshow_image wp-image-254" data-id="254" src="https://www.bebhuvan.com/wp-content/uploads/2022/04/Sovereign-default-rates-1024x519.png" srcset="https://www.bebhuvan.com/wp-content/uploads/2022/04/Sovereign-default-rates-1024x519.png 1024w, https://www.bebhuvan.com/wp-content/uploads/2022/04/Sovereign-default-rates-300x152.png 300w, https://www.bebhuvan.com/wp-content/uploads/2022/04/Sovereign-default-rates-768x389.png 768w, https://www.bebhuvan.com/wp-content/uploads/2022/04/Sovereign-default-rates.png 1074w" sizes="auto, (max-width: 1024px) 100vw, 1024px" />
</li>
<li class="wp-block-jetpack-slideshow_slide swiper-slide">
<img loading="lazy" decoding="async" width="1024" height="510" alt="" class="wp-block-jetpack-slideshow_image wp-image-255" data-id="255" src="https://www.bebhuvan.com/wp-content/uploads/2022/04/Sovereign-debt-banking-currency-crises-1024x510.png" srcset="https://www.bebhuvan.com/wp-content/uploads/2022/04/Sovereign-debt-banking-currency-crises-1024x510.png 1024w, https://www.bebhuvan.com/wp-content/uploads/2022/04/Sovereign-debt-banking-currency-crises-300x150.png 300w, https://www.bebhuvan.com/wp-content/uploads/2022/04/Sovereign-debt-banking-currency-crises-768x383.png 768w, https://www.bebhuvan.com/wp-content/uploads/2022/04/Sovereign-debt-banking-currency-crises.png 1240w" sizes="auto, (max-width: 1024px) 100vw, 1024px" />
</li>
</ul>
<a class="wp-block-jetpack-slideshow_button-prev swiper-button-prev swiper-button-white" role="button"></a><a class="wp-block-jetpack-slideshow_button-next swiper-button-next swiper-button-white" role="button"></a><a aria-label="Pause Slideshow" class="wp-block-jetpack-slideshow_button-pause" role="button"></a>
Emerging markets saw a series of sovereign debt crises from the 1970s to the early 2000s. The first wave of crises occurred between 1970-80 in Latin America. In the early 1970s, real interest rates were low and even negative. At the same time, thanks to the OPEC oil shocks, oil-exporting countries were enjoying record surpluses. Since oil was denominated in dollars, these surpluses were mostly parked with US banks looking for yield. During the 70s, Latin American economies were growing at a fast clip. Thanks to the low real rates, dollar funding was cheap. US banks were more than happy to lend these petrodollars to Latin American countries that wanted to invest in infrastructure, military and other public spending. These countries borrowed heavily. They were running large fiscal deficits and could sustain them since the GDP growth was high. External debt in Latin America shot up from $32 billion in 1970 to $332 billion in 1983. Latin American debt accounted for 176% of the capital of the 9 of the largest US banks.
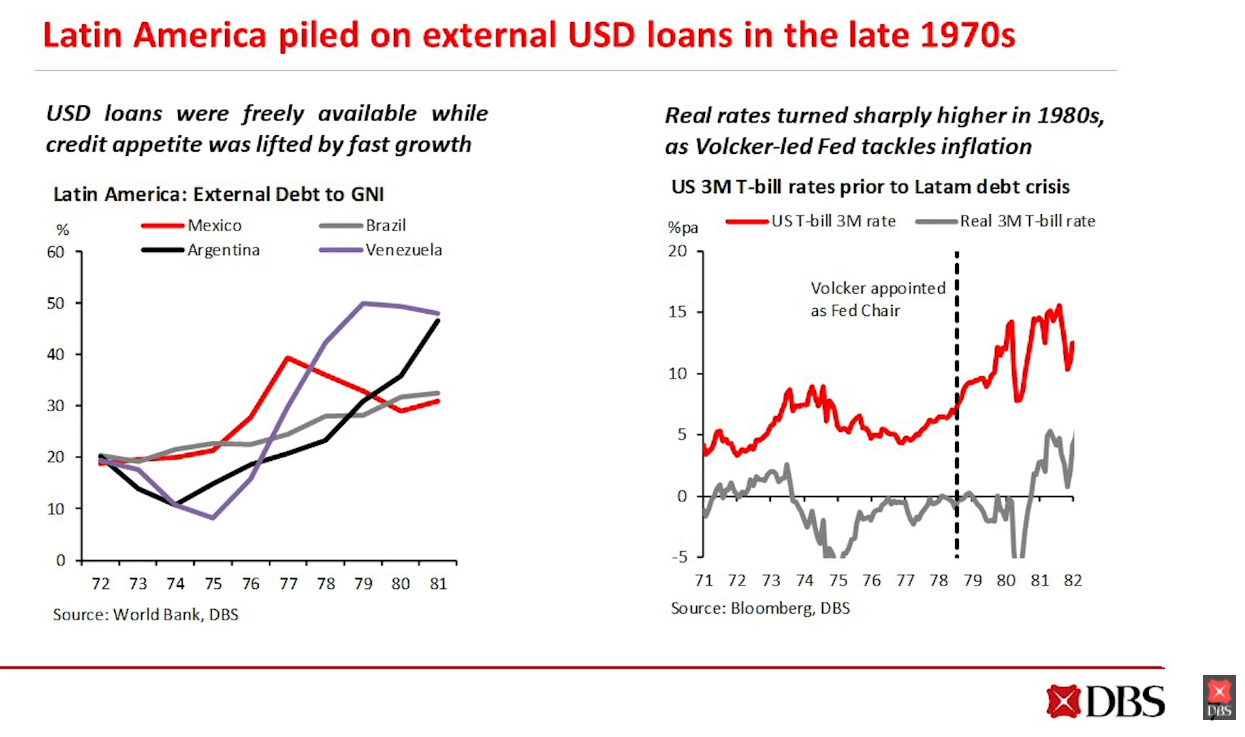
The 70s and 80s were a stubbornly high inflationary period in the US. In 1979, Paul Volcker was appointed as the Fed chair to tame inflation. Volcker promptly raised the interest rates to 20%, which put the US in recession and caused a global slowdown. Most of the debt of the Latin American countries were short-term floating rate loans. Suddenly, the debt servicing costs for Latin American counties shot up, currencies saw sharp devaluations, and they had to default.
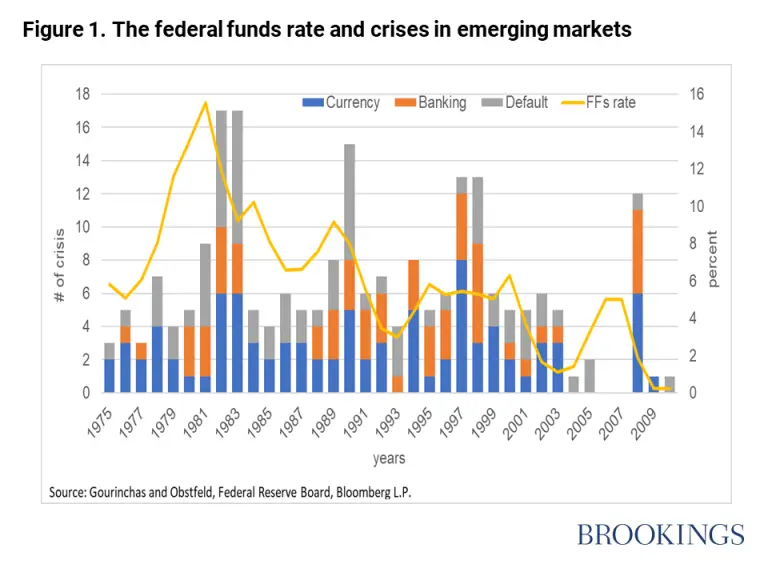
The next major episode of the sovereign debt crisis was the Asian Financial crisis. South Korea, Indonesia and Thailand were at the heart of the crisis. Philippines, Malaysia, and Hong Kong suffered collateral damage. The 90s were a low interest rate environment and investors in developing countries were starved for yield. At the same time, Asian countries were growing rapidly, and investors made a beeline to these countries. Foreign capital inflows to Asian countries rose from $9 billion in 1990 to about $80 billion by 1996. The flows were arbitraging interest rate differentials—borrow in a low interest rate country and invest in a high rate country. At the heart of the crisis was the good old maturity mismatch. Asian banks were borrowing short term in dollars and lending long term in their local currencies.
Suddenly in 1997, the flows reversed, and there were large scale outflows due to a confluence of factors. Companies that had borrowed heavily were unable to roll over their dollar debts. Money channelled into unproductive investments soured, and there was a crisis of confidence which amplified the panic, causing more outflows. Counties with fixed currencies and were unable to defend the pegs as they came under heavy attacks by speculators, given the dwindling foreign exchange reserves. Ultimately, these countries were forced to devalue their currencies, plunging the economies into deep recessions.
Since these crises, emerging market and developing economies (EMDEs), particularly Asian countries, have come a long way. Many of them are in far stronger positions than they were during the 90s. At the same time, many like the Latin American and Middle Eastern countries remain vulnerable.
What’s in a name?
People often talk about emerging, developing and frontier countries as if they are homogenous. There isn’t a standard definition of what an emerging market is. The term emerging markets often means any country that is not a developed country. The IMF classifies 39 economies as advanced and the rest as emerging markets and developing. The J.P. Morgan emerging markets bond index has over 65 countries, the MSCI EM index has 25 countries, FTSE Russel has 23, S&P Dow has 24 and so on. Some index providers label certain emerging countries as frontier economies. But broadly, an emerging market is a fast-growing economy with good economic prospects. It could mean any country from China to Guyana.
Emerging and developing economies have come a long way since the Latin American and Asian Financial crises. Many countries developed local bond markets and diversified their investor base to reduce their dependence on foreign currency borrowing. Most of them also abandoned fixed currencies and allowed their currencies to float, albeit with some intervention from their central banks. They also built substantial foreign exchange (FX) reserves to deal with sudden shocks. 70-80% of total global reserves are held by emerging market central banks. But progress has been uneven, and several emerging, low income and frontier economies remain vulnerable.
So, why are people crying wolf about emerging markets?
Before we get to that, here’s a bird’s eye view of global and EMEA sovereigns by credit rating trends and outlook. You can dunk on credit rating agencies all you want, but they’re still one of the best ways to get a sense of the credit quality of countries and companies. CDS spreads, and bond yields may be better, but getting this data is a nightmare 😭
Global
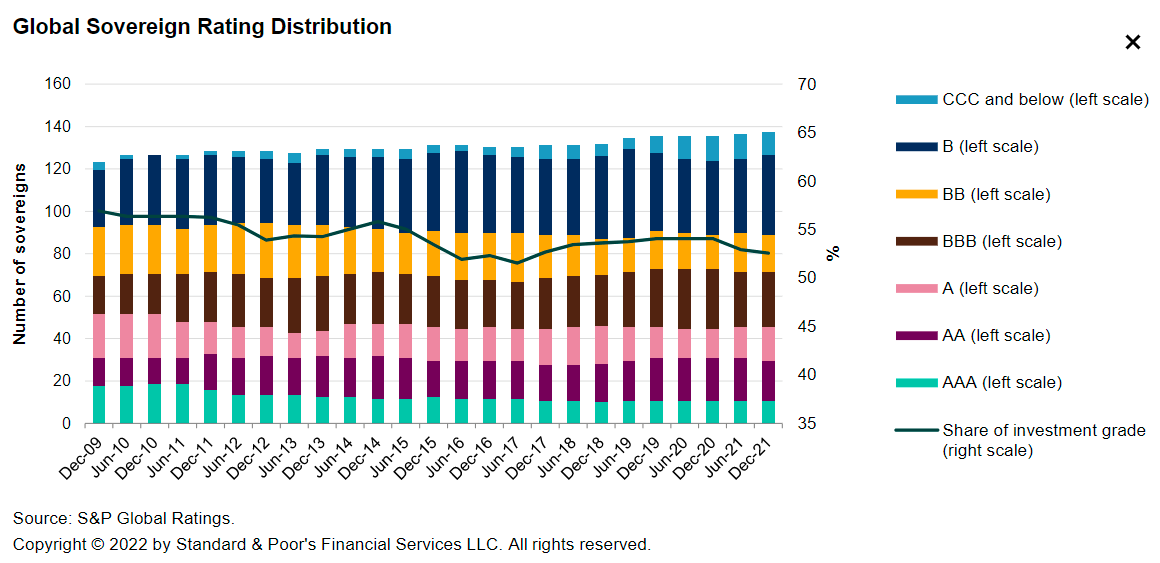
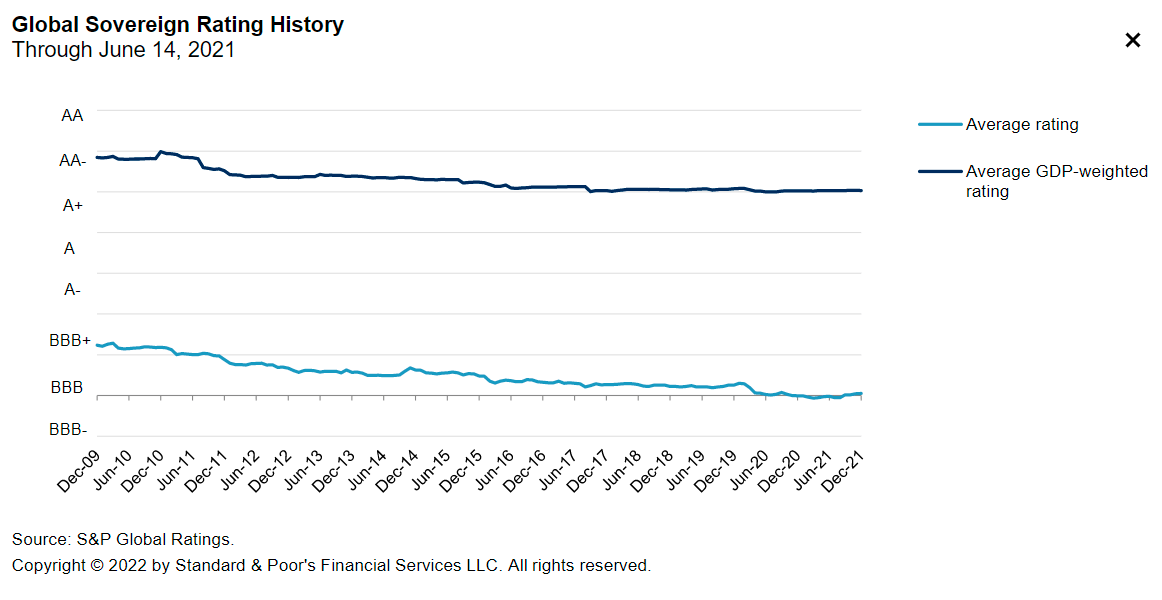
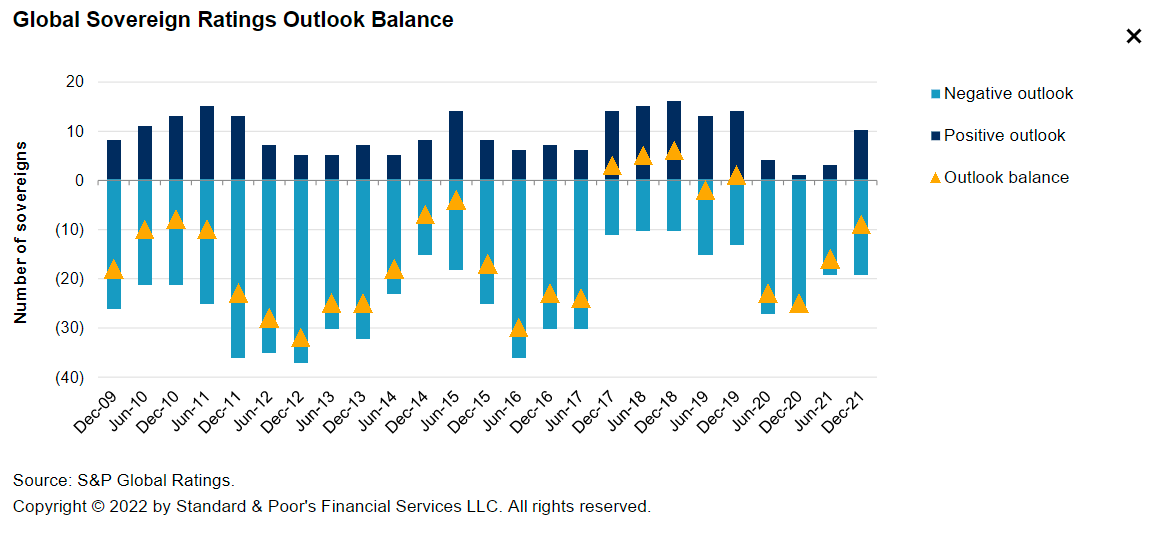
Global credit ratings have progressively worsened since the global financial crisis (GFC), and the COVID-19 shock accelerated some of that. 25% of countries rated by S&P saw at least one rating downgrade between January 2020 and September 2021.
<ul class="wp-block-jetpack-slideshow_swiper-wrapper swiper-wrapper">
<li class="wp-block-jetpack-slideshow_slide swiper-slide">
<img loading="lazy" decoding="async" width="1024" height="497" alt="" class="wp-block-jetpack-slideshow_image wp-image-257" data-id="257" src="https://www.bebhuvan.com/wp-content/uploads/2022/05/Global-sovereign-rating-distribution-1024x497.png" srcset="https://www.bebhuvan.com/wp-content/uploads/2022/05/Global-sovereign-rating-distribution-1024x497.png 1024w, https://www.bebhuvan.com/wp-content/uploads/2022/05/Global-sovereign-rating-distribution-300x146.png 300w, https://www.bebhuvan.com/wp-content/uploads/2022/05/Global-sovereign-rating-distribution-768x373.png 768w, https://www.bebhuvan.com/wp-content/uploads/2022/05/Global-sovereign-rating-distribution.png 1160w" sizes="auto, (max-width: 1024px) 100vw, 1024px" />
</li>
<li class="wp-block-jetpack-slideshow_slide swiper-slide">
<img loading="lazy" decoding="async" width="1024" height="529" alt="" class="wp-block-jetpack-slideshow_image wp-image-258" data-id="258" src="https://www.bebhuvan.com/wp-content/uploads/2022/05/Global-sovereign-rating-history-1024x529.png" srcset="https://www.bebhuvan.com/wp-content/uploads/2022/05/Global-sovereign-rating-history-1024x529.png 1024w, https://www.bebhuvan.com/wp-content/uploads/2022/05/Global-sovereign-rating-history-300x155.png 300w, https://www.bebhuvan.com/wp-content/uploads/2022/05/Global-sovereign-rating-history-768x397.png 768w, https://www.bebhuvan.com/wp-content/uploads/2022/05/Global-sovereign-rating-history.png 1162w" sizes="auto, (max-width: 1024px) 100vw, 1024px" />
</li>
<li class="wp-block-jetpack-slideshow_slide swiper-slide">
<img loading="lazy" decoding="async" width="1024" height="518" alt="" class="wp-block-jetpack-slideshow_image wp-image-259" data-id="259" src="https://www.bebhuvan.com/wp-content/uploads/2022/05/Global-sovereign-rating-outlook-by-region-1024x518.png" srcset="https://www.bebhuvan.com/wp-content/uploads/2022/05/Global-sovereign-rating-outlook-by-region-1024x518.png 1024w, https://www.bebhuvan.com/wp-content/uploads/2022/05/Global-sovereign-rating-outlook-by-region-300x152.png 300w, https://www.bebhuvan.com/wp-content/uploads/2022/05/Global-sovereign-rating-outlook-by-region-768x388.png 768w, https://www.bebhuvan.com/wp-content/uploads/2022/05/Global-sovereign-rating-outlook-by-region.png 1163w" sizes="auto, (max-width: 1024px) 100vw, 1024px" />
</li>
<li class="wp-block-jetpack-slideshow_slide swiper-slide">
<img loading="lazy" decoding="async" width="1024" height="475" alt="" class="wp-block-jetpack-slideshow_image wp-image-260" data-id="260" src="https://www.bebhuvan.com/wp-content/uploads/2022/05/Global-sovereign-rating-outlook-1024x475.png" srcset="https://www.bebhuvan.com/wp-content/uploads/2022/05/Global-sovereign-rating-outlook-1024x475.png 1024w, https://www.bebhuvan.com/wp-content/uploads/2022/05/Global-sovereign-rating-outlook-300x139.png 300w, https://www.bebhuvan.com/wp-content/uploads/2022/05/Global-sovereign-rating-outlook-768x356.png 768w, https://www.bebhuvan.com/wp-content/uploads/2022/05/Global-sovereign-rating-outlook.png 1156w" sizes="auto, (max-width: 1024px) 100vw, 1024px" />
</li>
</ul>
<a class="wp-block-jetpack-slideshow_button-prev swiper-button-prev swiper-button-white" role="button"></a><a class="wp-block-jetpack-slideshow_button-next swiper-button-next swiper-button-white" role="button"></a><a aria-label="Pause Slideshow" class="wp-block-jetpack-slideshow_button-pause" role="button"></a>
EMEA
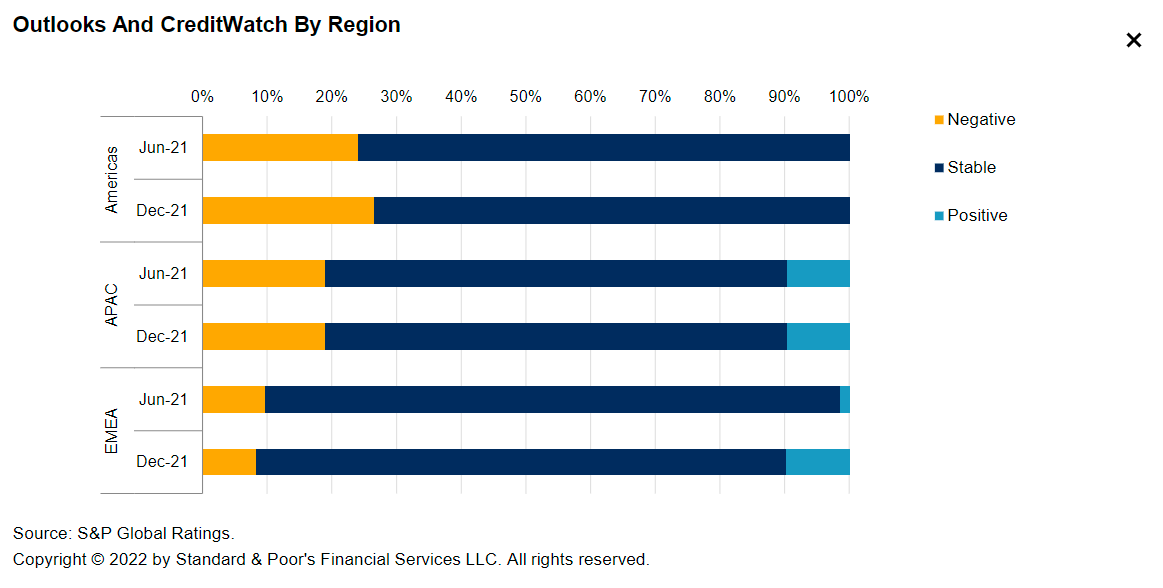
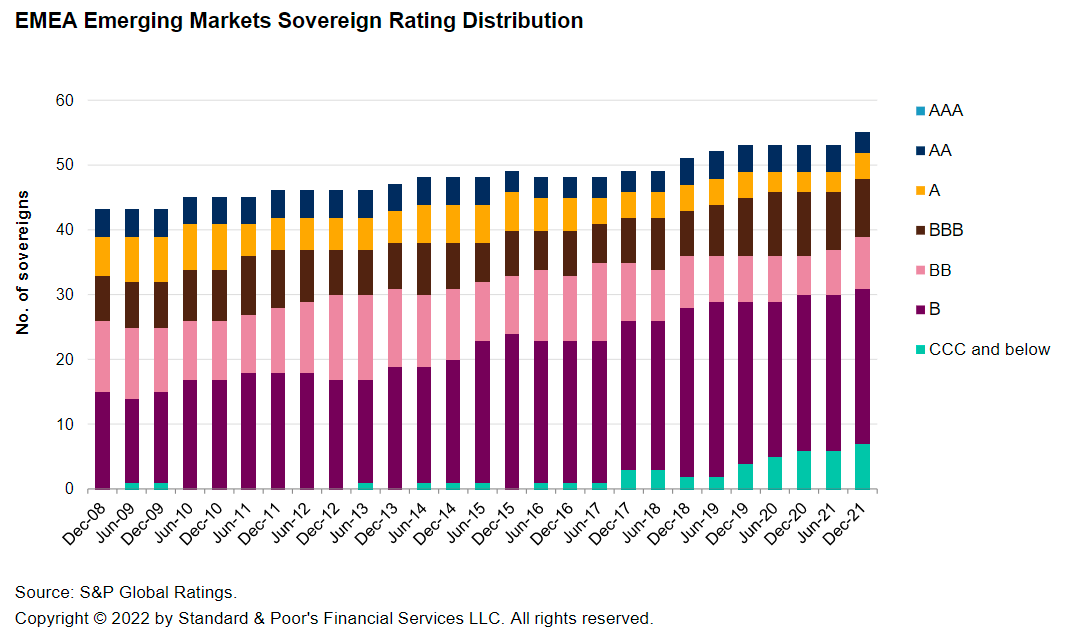
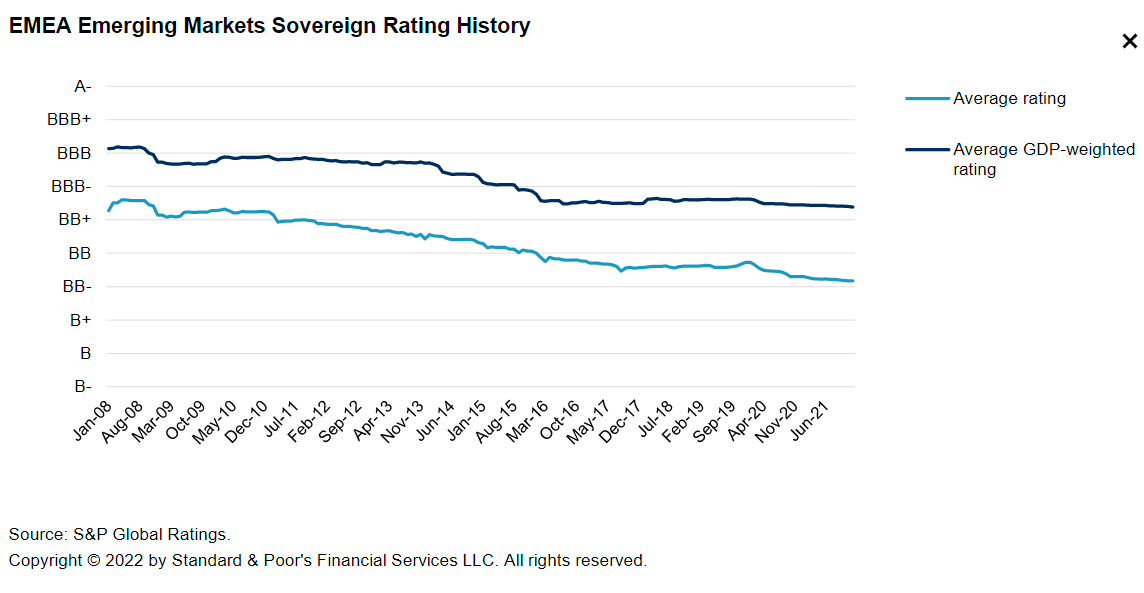
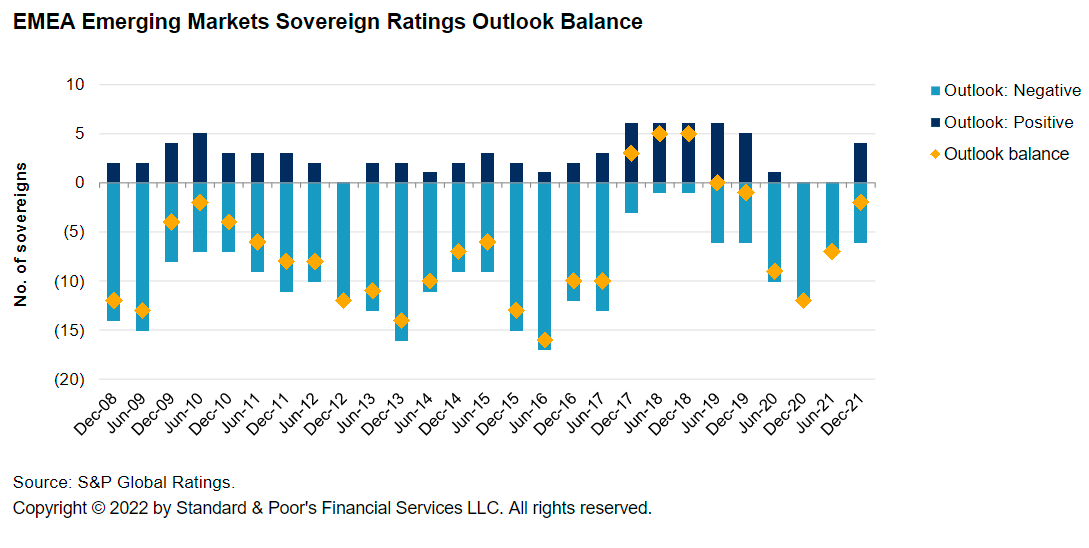
You can get a better sense when you break it up and look at regions. Here are the ratings for the Europe, the Middle East and Africa (EEMA) region. S&P has a stable outlook for 44 of the 54 EMEA countries.
<ul class="wp-block-jetpack-slideshow_swiper-wrapper swiper-wrapper">
<li class="wp-block-jetpack-slideshow_slide swiper-slide">
<img loading="lazy" decoding="async" width="1024" height="613" alt="" class="wp-block-jetpack-slideshow_image wp-image-266" data-id="266" src="https://www.bebhuvan.com/wp-content/uploads/2022/05/EMEA-Emerging-Markets-Sovereign-Ratings-1024x613.png" srcset="https://www.bebhuvan.com/wp-content/uploads/2022/05/EMEA-Emerging-Markets-Sovereign-Ratings-1024x613.png 1024w, https://www.bebhuvan.com/wp-content/uploads/2022/05/EMEA-Emerging-Markets-Sovereign-Ratings-300x180.png 300w, https://www.bebhuvan.com/wp-content/uploads/2022/05/EMEA-Emerging-Markets-Sovereign-Ratings-768x460.png 768w, https://www.bebhuvan.com/wp-content/uploads/2022/05/EMEA-Emerging-Markets-Sovereign-Ratings.png 1065w" sizes="auto, (max-width: 1024px) 100vw, 1024px" />
</li>
<li class="wp-block-jetpack-slideshow_slide swiper-slide">
<img loading="lazy" decoding="async" width="1024" height="531" alt="" class="wp-block-jetpack-slideshow_image wp-image-265" data-id="265" src="https://www.bebhuvan.com/wp-content/uploads/2022/05/EMEA-Emerging-Markets-Sovereign-Ratings-history-1024x531.png" srcset="https://www.bebhuvan.com/wp-content/uploads/2022/05/EMEA-Emerging-Markets-Sovereign-Ratings-history-1024x531.png 1024w, https://www.bebhuvan.com/wp-content/uploads/2022/05/EMEA-Emerging-Markets-Sovereign-Ratings-history-300x156.png 300w, https://www.bebhuvan.com/wp-content/uploads/2022/05/EMEA-Emerging-Markets-Sovereign-Ratings-history-768x398.png 768w, https://www.bebhuvan.com/wp-content/uploads/2022/05/EMEA-Emerging-Markets-Sovereign-Ratings-history.png 1144w" sizes="auto, (max-width: 1024px) 100vw, 1024px" />
</li>
<li class="wp-block-jetpack-slideshow_slide swiper-slide">
<img loading="lazy" decoding="async" width="1024" height="515" alt="" class="wp-block-jetpack-slideshow_image wp-image-264" data-id="264" src="https://www.bebhuvan.com/wp-content/uploads/2022/05/EMEA-Emerging-Markets-Sovereign-outlook-balance-1024x515.png" srcset="https://www.bebhuvan.com/wp-content/uploads/2022/05/EMEA-Emerging-Markets-Sovereign-outlook-balance-1024x515.png 1024w, https://www.bebhuvan.com/wp-content/uploads/2022/05/EMEA-Emerging-Markets-Sovereign-outlook-balance-300x151.png 300w, https://www.bebhuvan.com/wp-content/uploads/2022/05/EMEA-Emerging-Markets-Sovereign-outlook-balance-768x386.png 768w, https://www.bebhuvan.com/wp-content/uploads/2022/05/EMEA-Emerging-Markets-Sovereign-outlook-balance.png 1089w" sizes="auto, (max-width: 1024px) 100vw, 1024px" />
</li>
</ul>
<a class="wp-block-jetpack-slideshow_button-prev swiper-button-prev swiper-button-white" role="button"></a><a class="wp-block-jetpack-slideshow_button-next swiper-button-next swiper-button-white" role="button"></a><a aria-label="Pause Slideshow" class="wp-block-jetpack-slideshow_button-pause" role="button"></a>
But the balance sheets of these countries have deteriorated significantly post the pandemic. Sub-Saharan Africa (SSA) looks the most vulnerable due to a significant increase in debt servicing costs.
Asia-Pacific
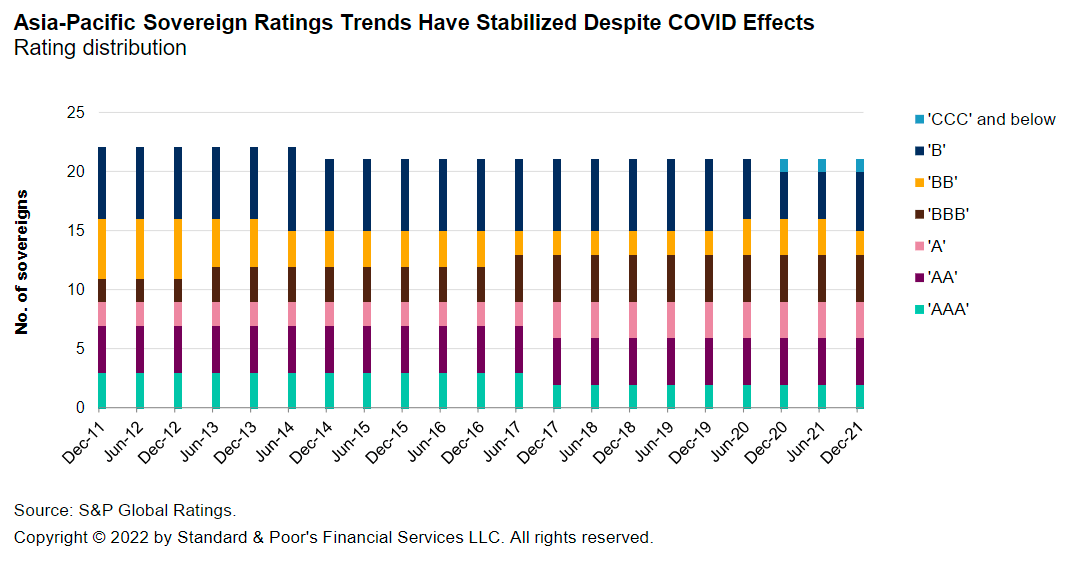
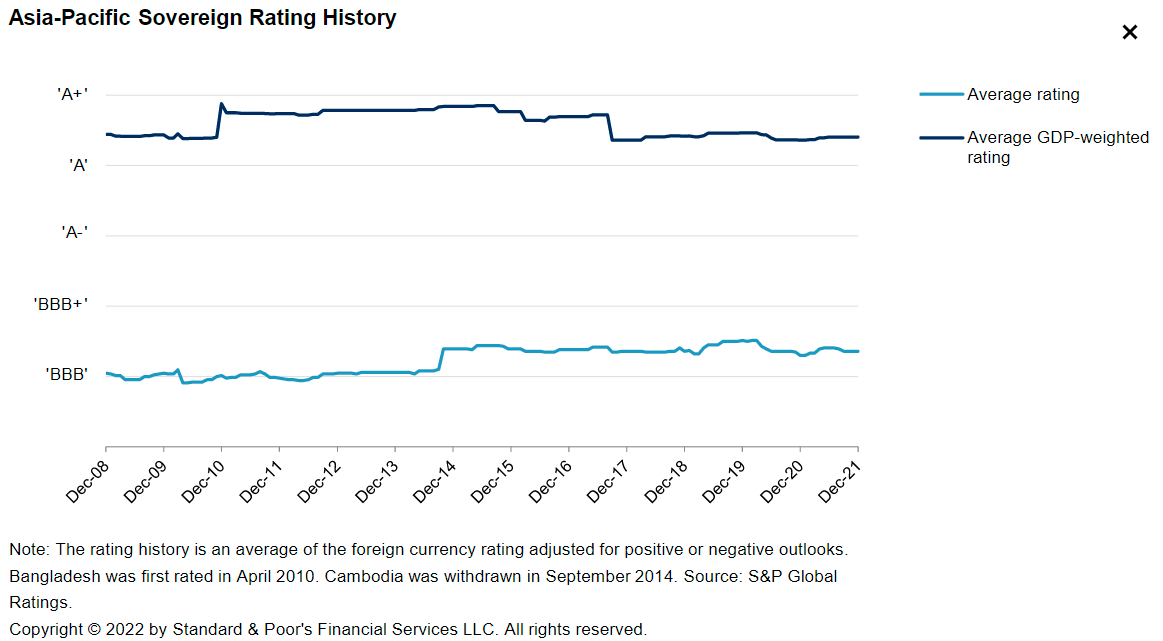
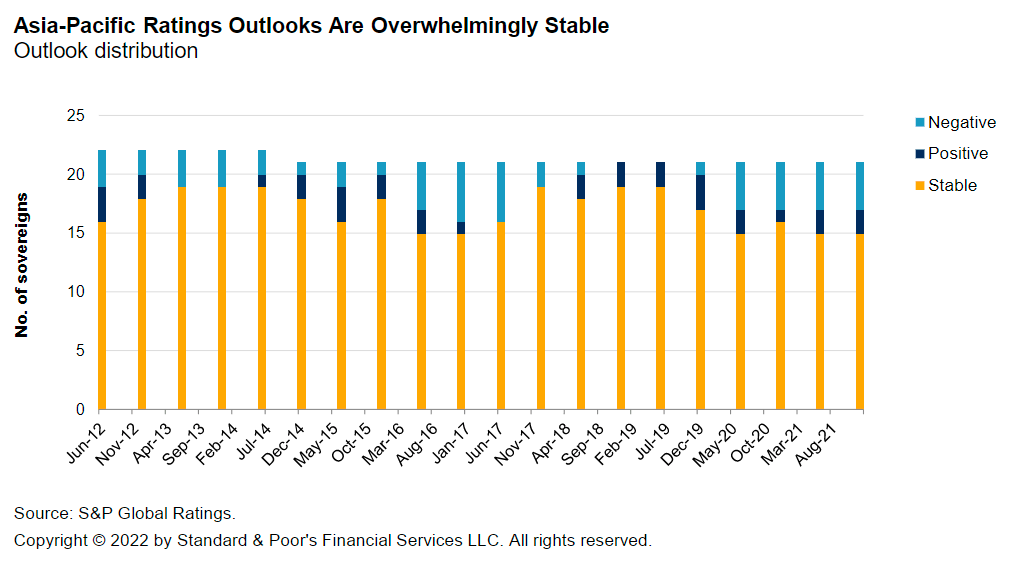
Asia-Pacific region is the most stable region around the world among emerging and developing countries.
<ul class="wp-block-jetpack-slideshow_swiper-wrapper swiper-wrapper">
<li class="wp-block-jetpack-slideshow_slide swiper-slide">
<img loading="lazy" decoding="async" width="1024" height="542" alt="" class="wp-block-jetpack-slideshow_image wp-image-268" data-id="268" src="https://www.bebhuvan.com/wp-content/uploads/2022/05/Asia-sovereign-rating-distribution-1024x542.png" srcset="https://www.bebhuvan.com/wp-content/uploads/2022/05/Asia-sovereign-rating-distribution-1024x542.png 1024w, https://www.bebhuvan.com/wp-content/uploads/2022/05/Asia-sovereign-rating-distribution-300x159.png 300w, https://www.bebhuvan.com/wp-content/uploads/2022/05/Asia-sovereign-rating-distribution-768x407.png 768w, https://www.bebhuvan.com/wp-content/uploads/2022/05/Asia-sovereign-rating-distribution.png 1075w" sizes="auto, (max-width: 1024px) 100vw, 1024px" />
</li>
<li class="wp-block-jetpack-slideshow_slide swiper-slide">
<img loading="lazy" decoding="async" width="1024" height="564" alt="" class="wp-block-jetpack-slideshow_image wp-image-269" data-id="269" src="https://www.bebhuvan.com/wp-content/uploads/2022/05/Asia-sovereign-rating-history-1024x564.png" srcset="https://www.bebhuvan.com/wp-content/uploads/2022/05/Asia-sovereign-rating-history-1024x564.png 1024w, https://www.bebhuvan.com/wp-content/uploads/2022/05/Asia-sovereign-rating-history-300x165.png 300w, https://www.bebhuvan.com/wp-content/uploads/2022/05/Asia-sovereign-rating-history-768x423.png 768w, https://www.bebhuvan.com/wp-content/uploads/2022/05/Asia-sovereign-rating-history.png 1163w" sizes="auto, (max-width: 1024px) 100vw, 1024px" />
</li>
<li class="wp-block-jetpack-slideshow_slide swiper-slide">
<img loading="lazy" decoding="async" width="1016" height="572" alt="" class="wp-block-jetpack-slideshow_image wp-image-270" data-id="270" src="https://www.bebhuvan.com/wp-content/uploads/2022/05/Asia-sovereign-rating-outlook.png" srcset="https://www.bebhuvan.com/wp-content/uploads/2022/05/Asia-sovereign-rating-outlook.png 1016w, https://www.bebhuvan.com/wp-content/uploads/2022/05/Asia-sovereign-rating-outlook-300x169.png 300w, https://www.bebhuvan.com/wp-content/uploads/2022/05/Asia-sovereign-rating-outlook-768x432.png 768w" sizes="auto, (max-width: 1016px) 100vw, 1016px" />
</li>
</ul>
<a class="wp-block-jetpack-slideshow_button-prev swiper-button-prev swiper-button-white" role="button"></a><a class="wp-block-jetpack-slideshow_button-next swiper-button-next swiper-button-white" role="button"></a><a aria-label="Pause Slideshow" class="wp-block-jetpack-slideshow_button-pause" role="button"></a>
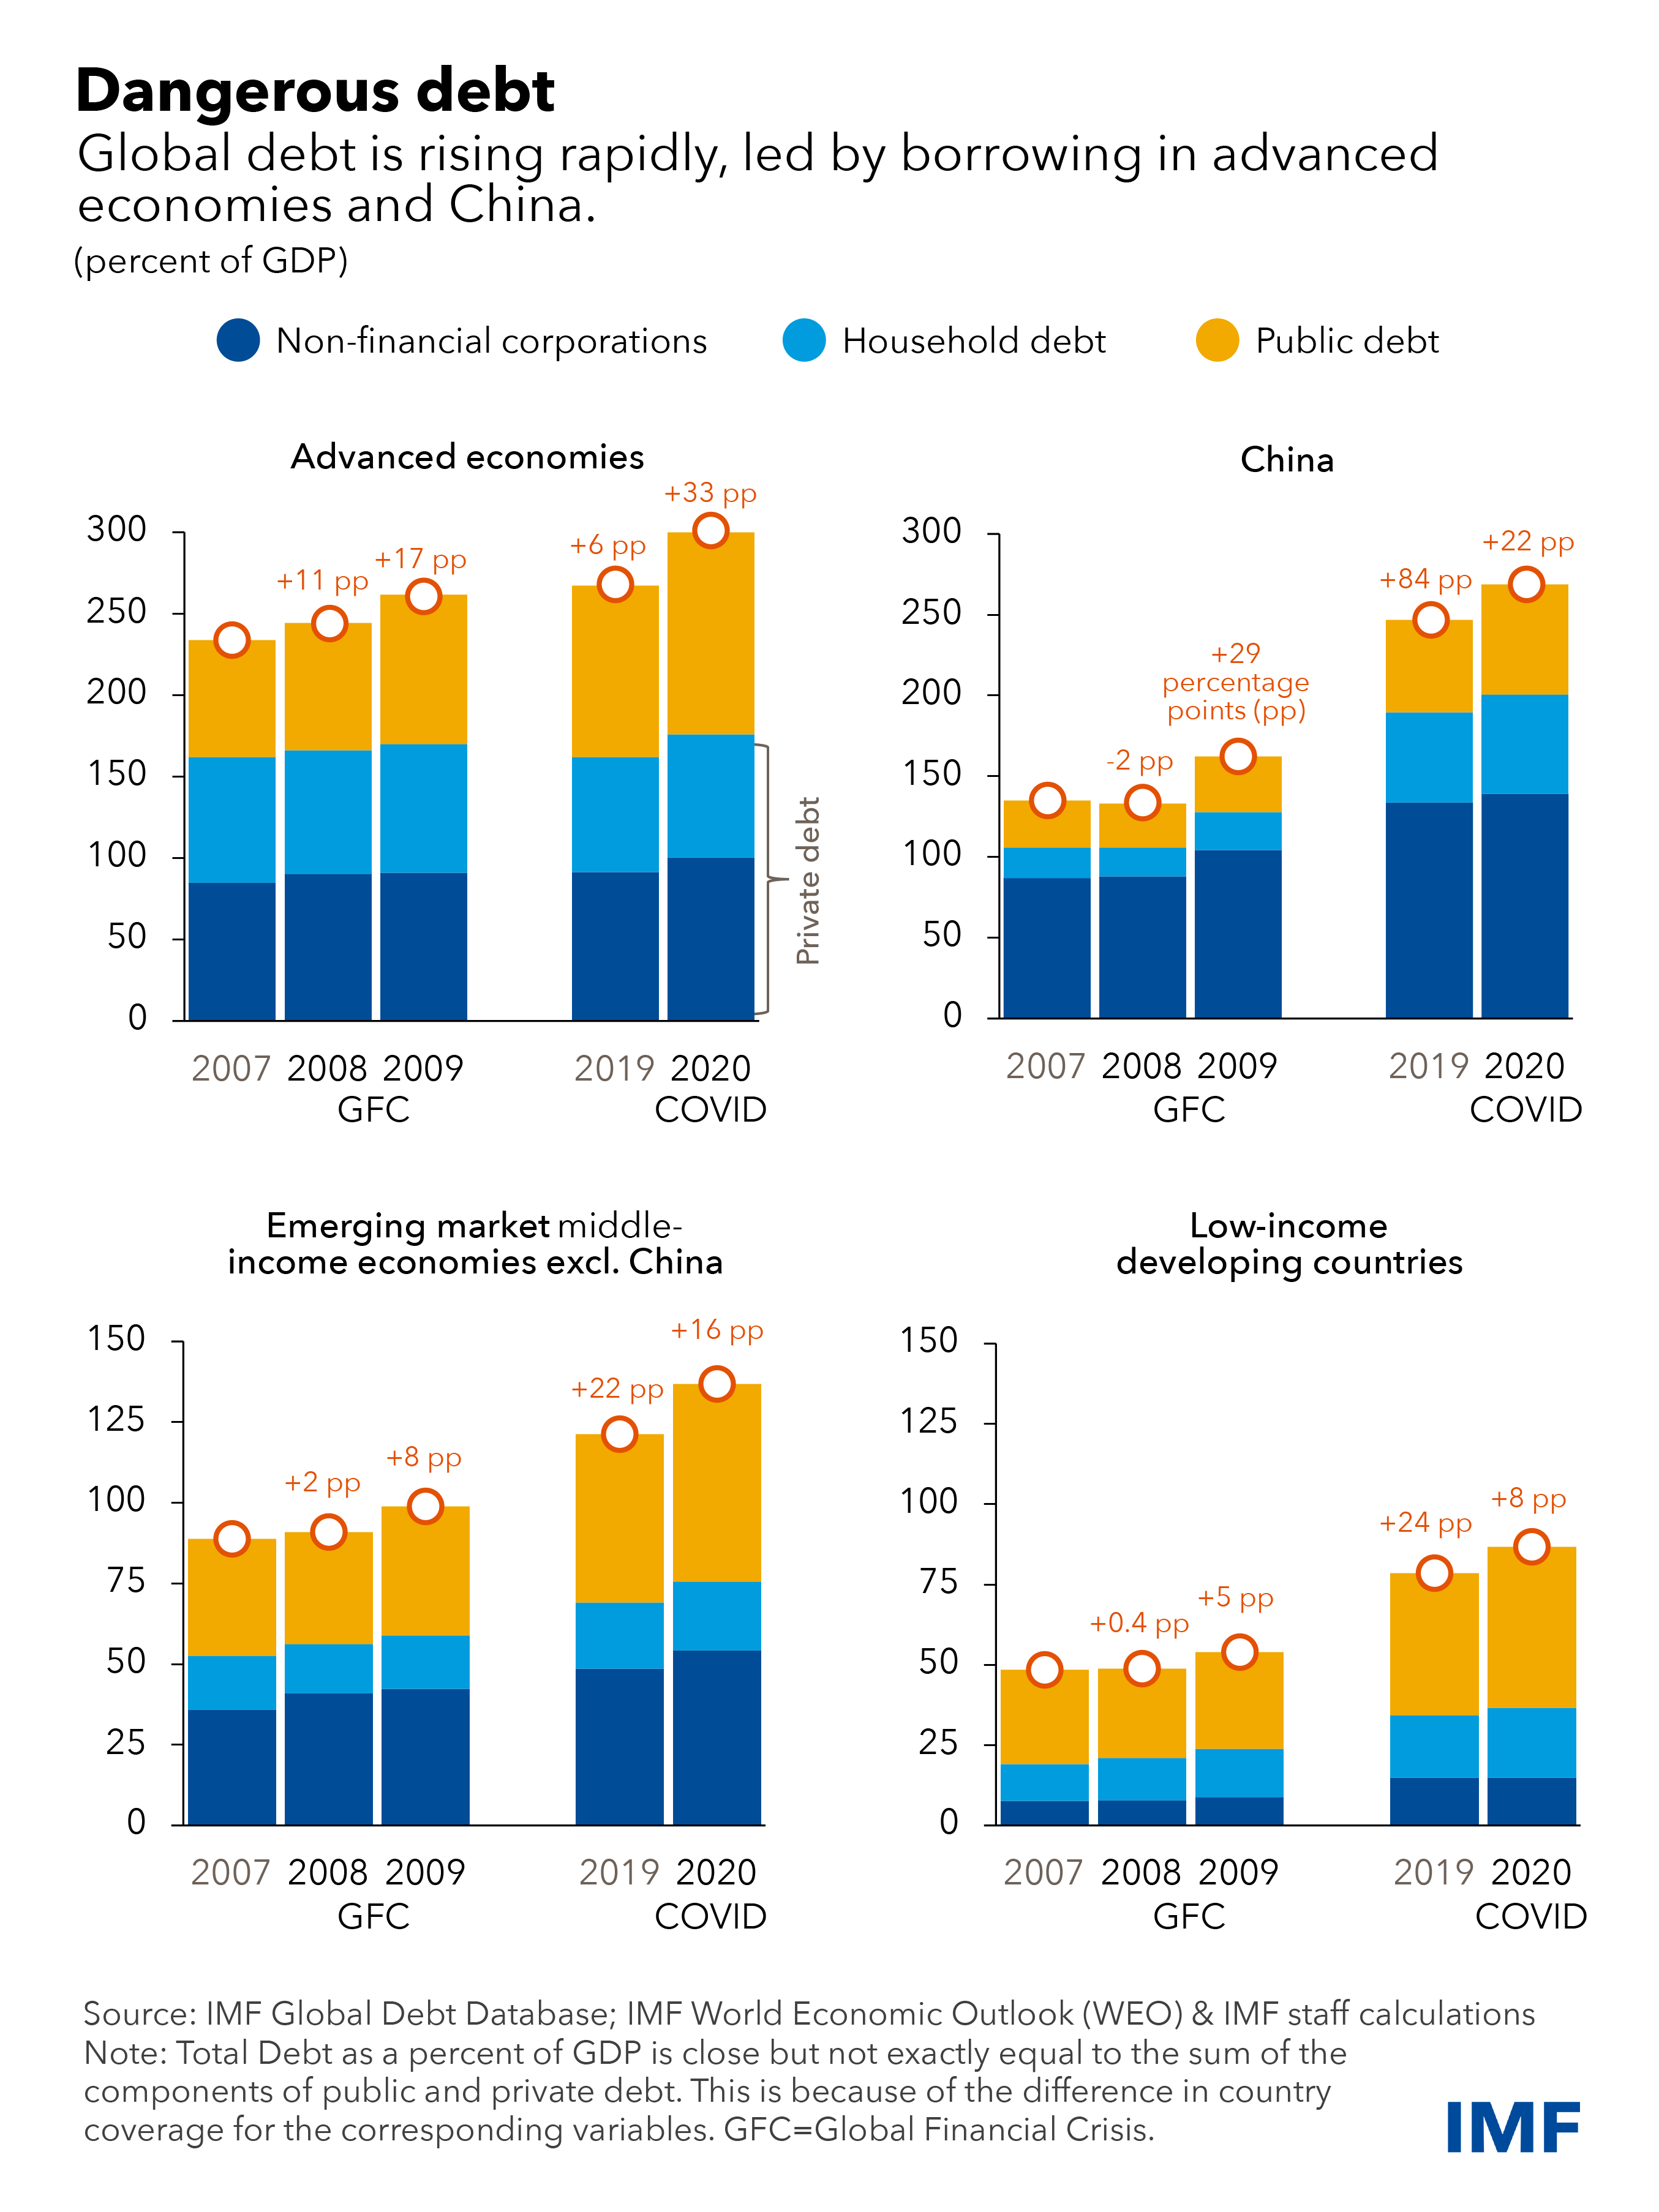
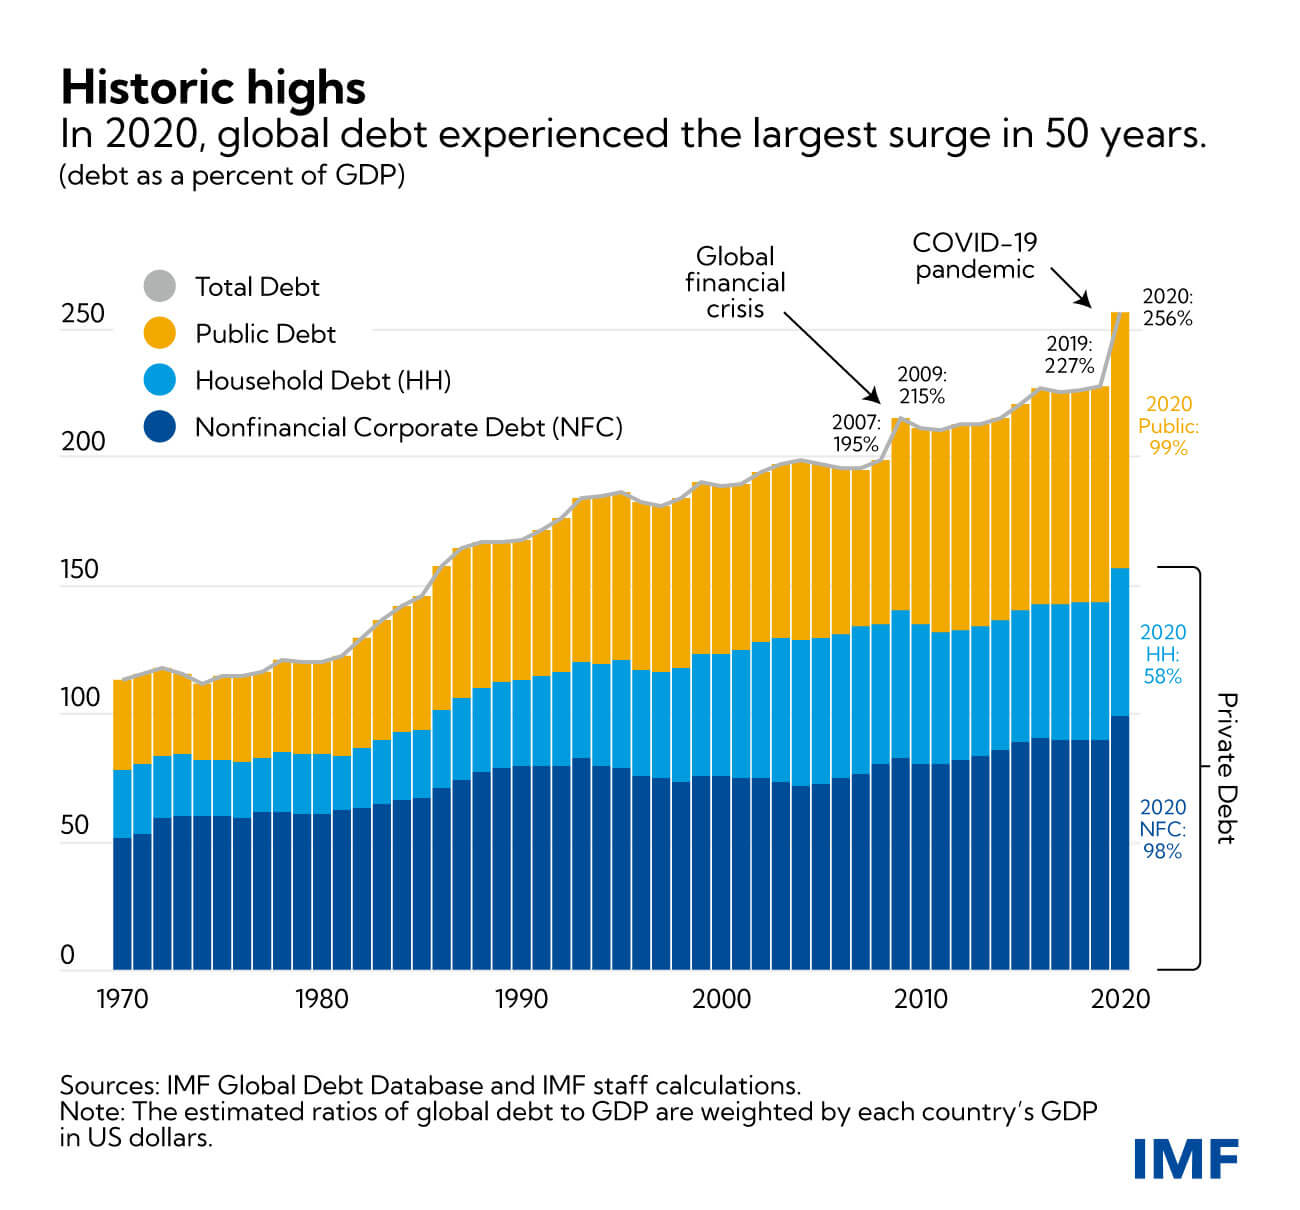
So, the reason why are crying wolf over a debt crisis in emerging markets is because of the COVID-19 pandemic. The entire global economy virtually ground to a halt. Countries around the world, especially the developed economies, unleashed fiscal stimulus on a scale we have never seen before. Emerging markets economies, too, had to spend but had limited policy space. Given the trillions in fiscal spending across the world, 2020 saw the biggest single-year increase in debt since World War II.
<ul class="wp-block-jetpack-slideshow_swiper-wrapper swiper-wrapper">
<li class="wp-block-jetpack-slideshow_slide swiper-slide">
<img loading="lazy" decoding="async" width="768" height="1024" alt="" class="wp-block-jetpack-slideshow_image wp-image-273" data-id="273" src="https://www.bebhuvan.com/wp-content/uploads/2022/05/Global-debt-1-768x1024.png" srcset="https://www.bebhuvan.com/wp-content/uploads/2022/05/Global-debt-1-768x1024.png 768w, https://www.bebhuvan.com/wp-content/uploads/2022/05/Global-debt-1-225x300.png 225w, https://www.bebhuvan.com/wp-content/uploads/2022/05/Global-debt-1-1152x1536.png 1152w, https://www.bebhuvan.com/wp-content/uploads/2022/05/Global-debt-1-1536x2048.png 1536w" sizes="auto, (max-width: 768px) 100vw, 768px" />
</li>
<li class="wp-block-jetpack-slideshow_slide swiper-slide">
<img loading="lazy" decoding="async" width="1024" height="953" alt="" class="wp-block-jetpack-slideshow_image wp-image-272" data-id="272" src="https://www.bebhuvan.com/wp-content/uploads/2022/05/global-debt-increase-1024x953.jpg" srcset="https://www.bebhuvan.com/wp-content/uploads/2022/05/global-debt-increase-1024x953.jpg 1024w, https://www.bebhuvan.com/wp-content/uploads/2022/05/global-debt-increase-300x279.jpg 300w, https://www.bebhuvan.com/wp-content/uploads/2022/05/global-debt-increase-768x715.jpg 768w, https://www.bebhuvan.com/wp-content/uploads/2022/05/global-debt-increase.jpg 1300w" sizes="auto, (max-width: 1024px) 100vw, 1024px" />
</li>
</ul>
<a class="wp-block-jetpack-slideshow_button-prev swiper-button-prev swiper-button-white" role="button"></a><a class="wp-block-jetpack-slideshow_button-next swiper-button-next swiper-button-white" role="button"></a><a aria-label="Pause Slideshow" class="wp-block-jetpack-slideshow_button-pause" role="button"></a>
These scenarios are what permabears live and die for. They’ve been screaming that all this debt and money printing would lead to hyperinflation, rising interest payments, high taxes and that developed and developing economies will become fifth world countries. But a high debt-to-GDP ratio on its own is quite meaningless. It’s a bit like saying the stock market is high. No two countries are the same, and comparing debt to GDP ratios is a fraught exercise. The composition of the debt, the economic growth rates, structure of the economy, institutions, the rule of law, central bank independence, interest rates, and inflation matter more. Just ask the exotic creatures who’ve been predicting the end for the US and Japan because of the rising debt-to-GDP ratios since the 2000s.
Anyway, given the record low interest rates around the world since 2008, debt wasn’t a problem. Low interest rates in developed markets caused a hunt for yield, and emerging market debt saw huge inflows. Except for the 2013 taper tantrum, the 2015 China shock and the 2020 COVID-19 crash, EM flows remained positive. But now that inflation is back in the US, the Federal Reserve has started to hike rates and is expected to continue hiking aggressively. More worryingly, for the emerging markets, the dollar has been strengthening, and this is bad news.
A strong dollar is bad for emerging markets because it increases the price of imports in dollar terms and can kill demand. It also increases the interest costs on dollar-denominated debt and makes refinancing costlier.
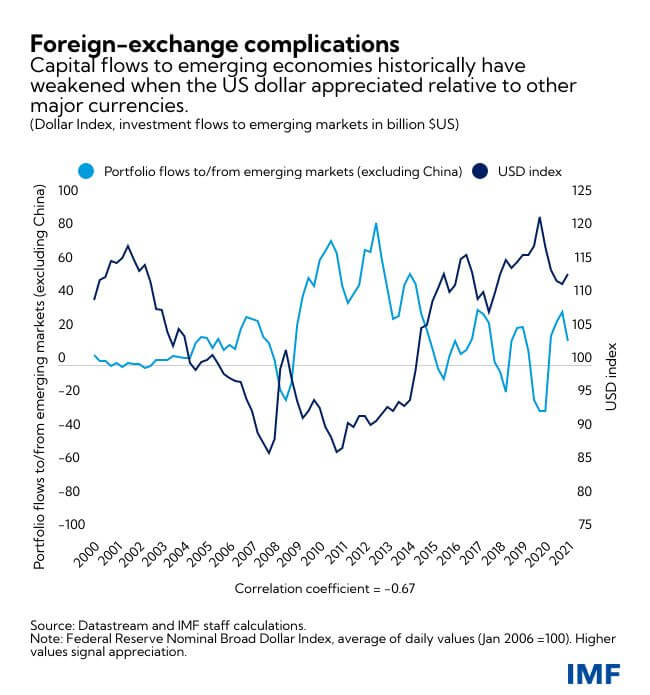
IMF
Boris Hofmann and Taejin Park had published an analysis in the BIS analyzing the impact of a stronger dollar. They showed that a rising dollar has a more pronounced effect on emerging markets with higher dollar debt and foreign ownership of local currency bonds.
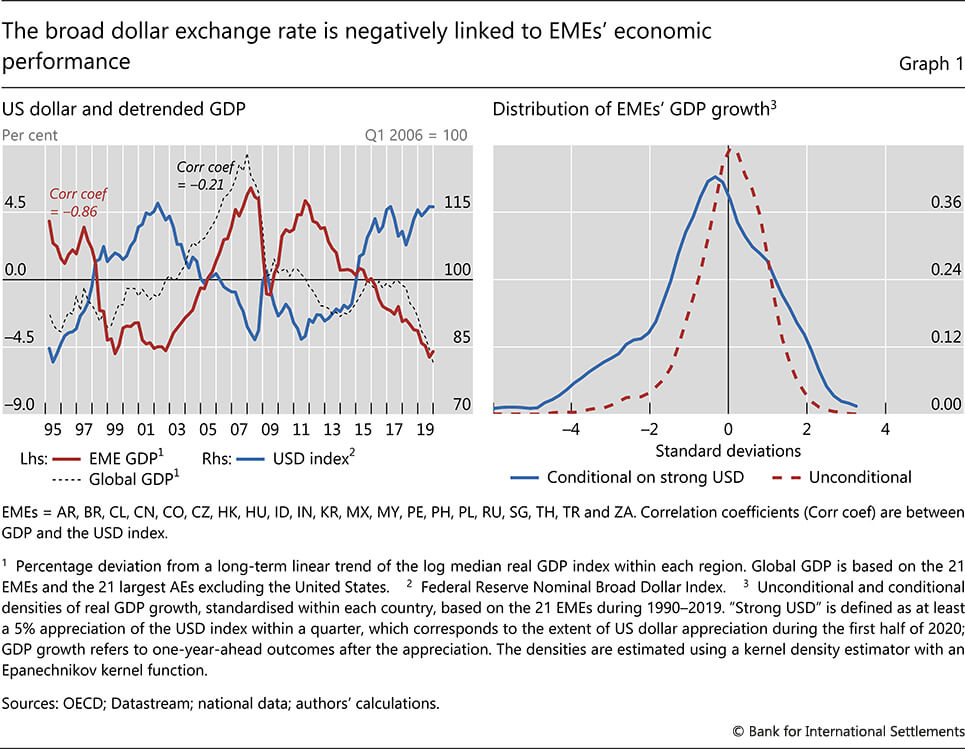
Since the rates in the US stayed low for a long time, the emerging markets sovereign debt doomsayers had to find a second job. But now, the US is finally in a rate hike cycle, these people have rediscovered their purpose in life. But there’s some nuance here.
Jasper Hoek, Emre Yoldas, and Steve Kamin published a paper looking at the impact of US rate hikes and the impact on emerging markets. They found that if the US hikes rates when economic growth is good, it isn’t a problem. But if inflation is rising in the US and the Fed is forced to become hawkish and hike rates, that’s bad news for emerging markets.
A strong dollar is negatively correlated with global trade and also leads to lower commodity prices. As emerging market currencies depreciate, demand takes a hit, leading to lower trade.
And this is where the problem is. There’s a significant divergence in post-pandemic economic recovery in emerging and developing economies.
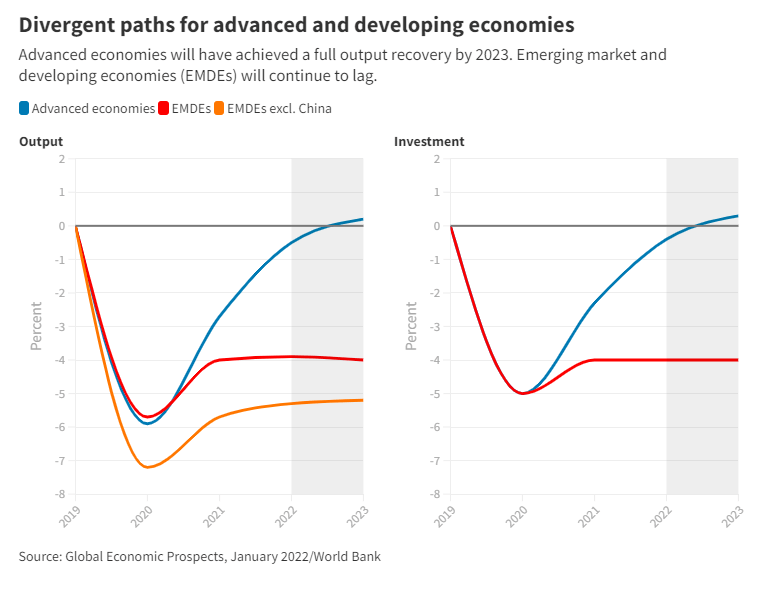
Commodity exporting emerging countries like Brazil, Mexico, Chile, Saudi Arabia etc., are seeing windfalls due to rising commodity prices. But commodity importing countries like Bangladesh, Vietnam, Thailand, and India have taken a hit. Tourism dependent countries like Turkey, Thailand etc., have been hit the hardest. Their economic recoveries are significantly off the pre-pandemic trend.
At this point, it’s important to remember that not all emerging and developing economies (EMDE) are the same.
Several Asian EMDEs like India, Thailand, South Korea, and Malaysia are in a significantly better place having built substantial FX reserves. But low-income developing countries aren’t in such good shape. In the recent World Economic Outlook, the IMF noted that “60 percent of low-income developing countries are already in debt distress or at high risk of distress.”
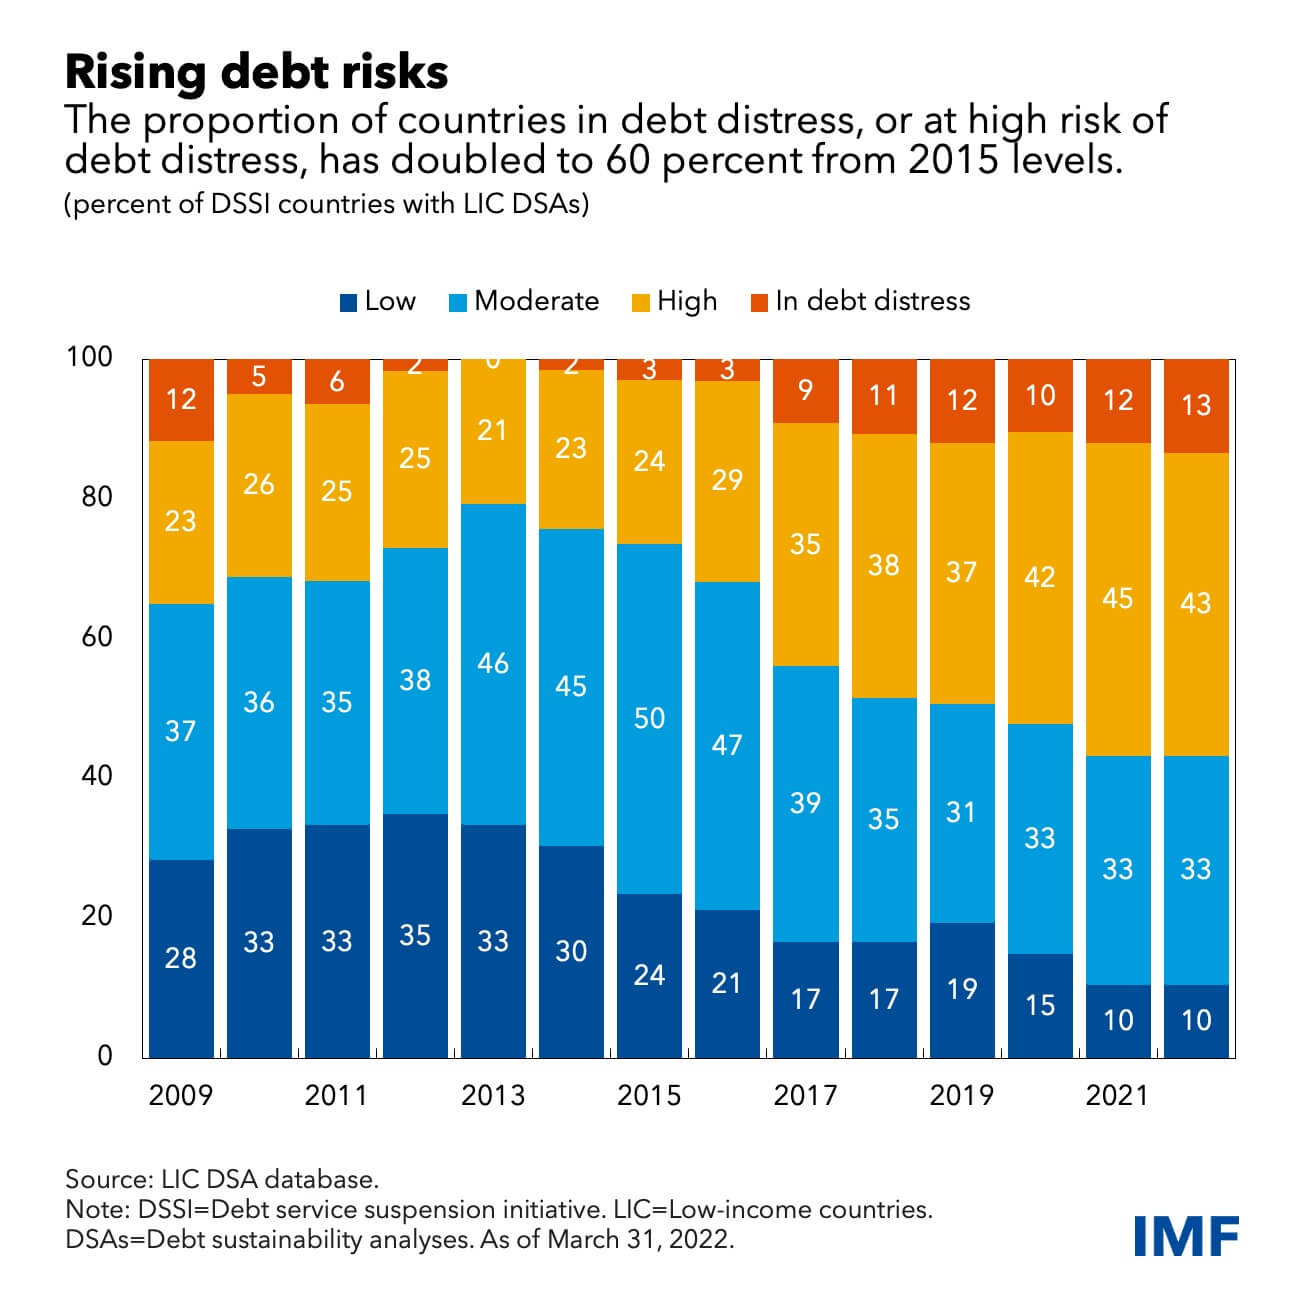
Among the 41 DSSI countries at high risk of or in debt distress, Chad, Ethiopia, Somalia (under the HIPC framework) and Zambia have already requested a debt treatment. Around 20 others exhibit significant breaches of applicable high-risk thresholds, half of which also have low reserves, rising gross financing needs, or a combination of the two in 2022.
— IMF
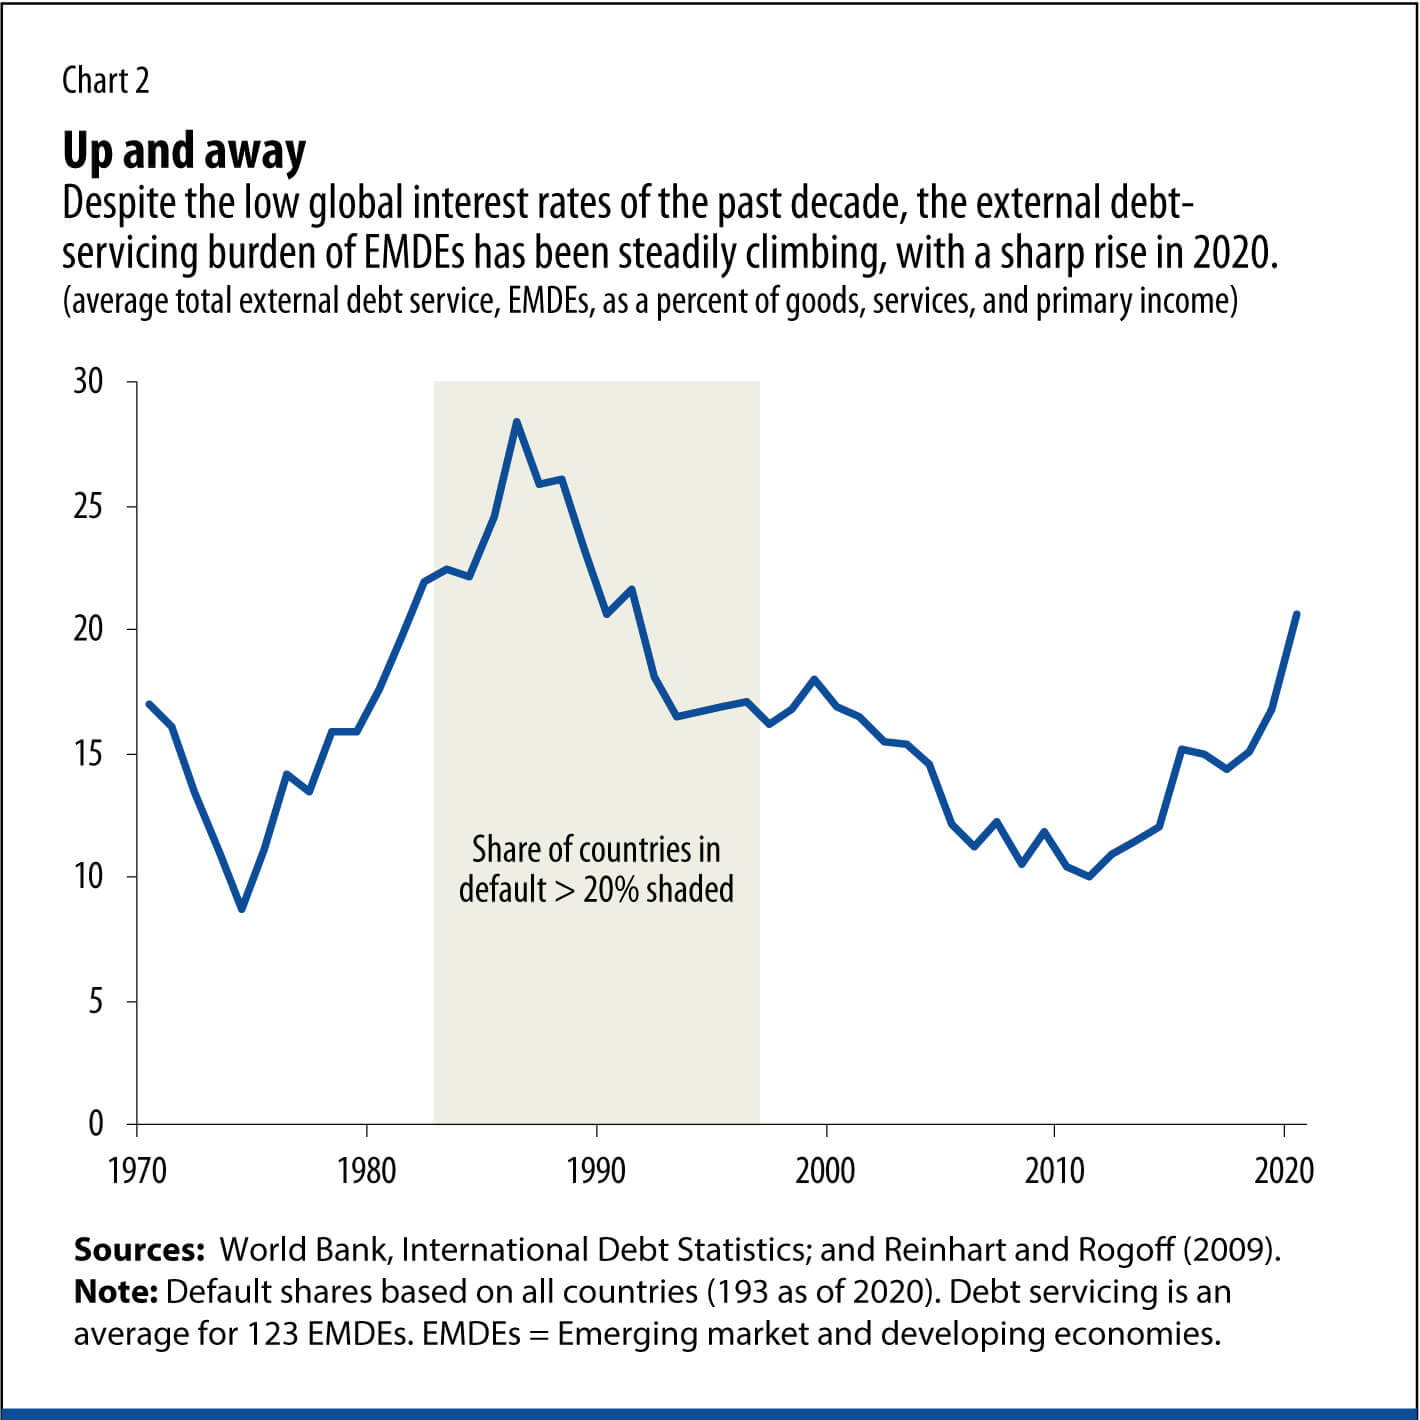
For a lot of these emerging and developing countries, debt servicing costs have been going up over the past decade.
<ul class="wp-block-jetpack-slideshow_swiper-wrapper swiper-wrapper">
<li class="wp-block-jetpack-slideshow_slide swiper-slide">
<img loading="lazy" decoding="async" width="1024" height="1024" alt="" class="wp-block-jetpack-slideshow_image wp-image-282" data-id="282" src="https://www.bebhuvan.com/wp-content/uploads/2022/05/Emerging-markets-interest-coverage-1024x1024.jpg" srcset="https://www.bebhuvan.com/wp-content/uploads/2022/05/Emerging-markets-interest-coverage-1024x1024.jpg 1024w, https://www.bebhuvan.com/wp-content/uploads/2022/05/Emerging-markets-interest-coverage-300x300.jpg 300w, https://www.bebhuvan.com/wp-content/uploads/2022/05/Emerging-markets-interest-coverage-150x150.jpg 150w, https://www.bebhuvan.com/wp-content/uploads/2022/05/Emerging-markets-interest-coverage-768x768.jpg 768w, https://www.bebhuvan.com/wp-content/uploads/2022/05/Emerging-markets-interest-coverage.jpg 1420w" sizes="auto, (max-width: 1024px) 100vw, 1024px" />
</li>
<li class="wp-block-jetpack-slideshow_slide swiper-slide">
<img loading="lazy" decoding="async" width="993" height="1024" alt="" class="wp-block-jetpack-slideshow_image wp-image-281" data-id="281" src="https://www.bebhuvan.com/wp-content/uploads/2022/05/Emerging-markets-interest-coverage-range-993x1024.jpg" srcset="https://www.bebhuvan.com/wp-content/uploads/2022/05/Emerging-markets-interest-coverage-range-993x1024.jpg 993w, https://www.bebhuvan.com/wp-content/uploads/2022/05/Emerging-markets-interest-coverage-range-291x300.jpg 291w, https://www.bebhuvan.com/wp-content/uploads/2022/05/Emerging-markets-interest-coverage-range-768x792.jpg 768w, https://www.bebhuvan.com/wp-content/uploads/2022/05/Emerging-markets-interest-coverage-range.jpg 1420w" sizes="auto, (max-width: 993px) 100vw, 993px" />
</li>
</ul>
<a class="wp-block-jetpack-slideshow_button-prev swiper-button-prev swiper-button-white" role="button"></a><a class="wp-block-jetpack-slideshow_button-next swiper-button-next swiper-button-white" role="button"></a><a aria-label="Pause Slideshow" class="wp-block-jetpack-slideshow_button-pause" role="button"></a>
The IMF In the report highlighted that lower growth prospects, especially for China, rising geopolitical tensions, rising energy prices and food prices are creating severe headwinds for these economies. In the April 2022 Global Financial Stability Report, the IMF noted that several emerging markets have already come under severe pressure. 25% of foreign currency (hard currency) issuing emerging economies are trading in the distressed territory.
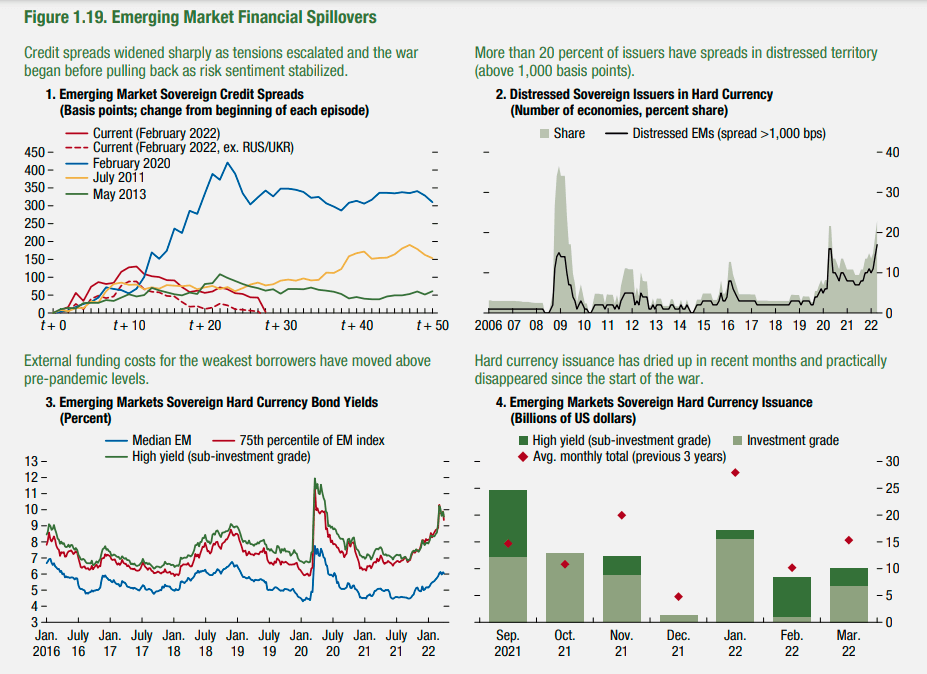
The World Bank also raised the alarm on the rising variable (floating) rate debt among the 74 of the poorest economies. Variable rate debt has increased from 20% in 2008 to 31% in 2022
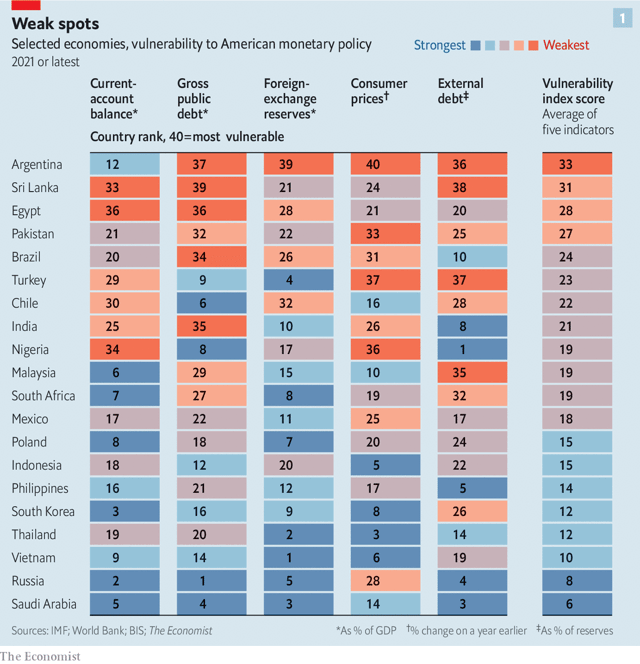
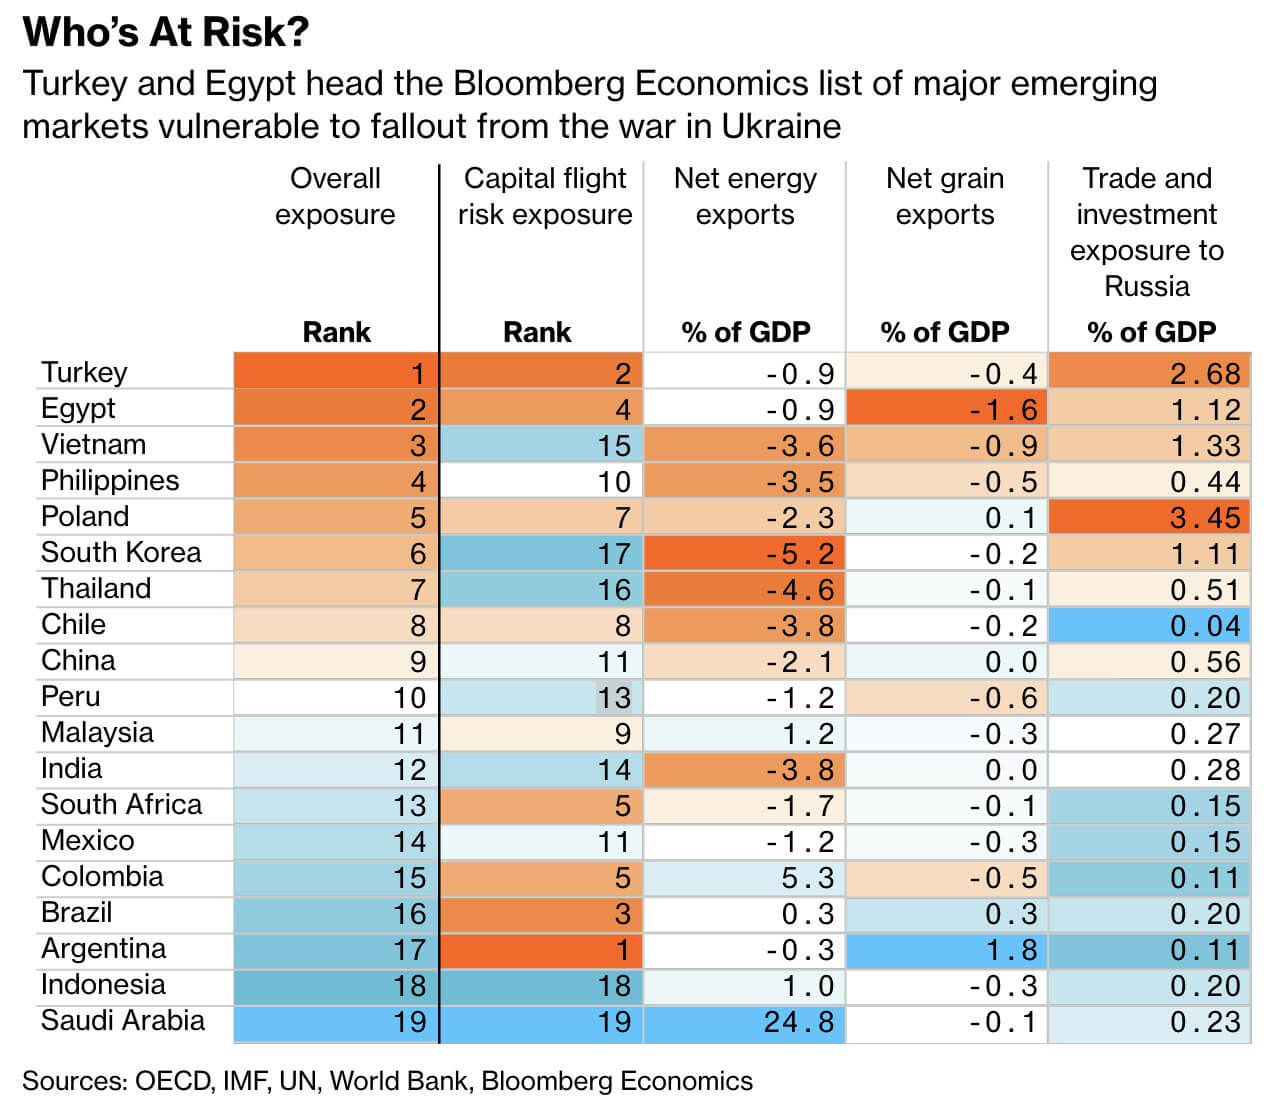
To sum up, here’s a quick overview of emerging and developing economies by vulnerability on various metrics by The Economist and Bloomberg. It’s mostly the basket cases that are in the most trouble:
<ul class="wp-block-jetpack-slideshow_swiper-wrapper swiper-wrapper">
<li class="wp-block-jetpack-slideshow_slide swiper-slide">
<img loading="lazy" decoding="async" width="640" height="664" alt="" class="wp-block-jetpack-slideshow_image wp-image-279" data-id="279" src="https://www.bebhuvan.com/wp-content/uploads/2022/05/Emerging-markets-vulnerable-to-rising-US-interest-rates.png" srcset="https://www.bebhuvan.com/wp-content/uploads/2022/05/Emerging-markets-vulnerable-to-rising-US-interest-rates.png 640w, https://www.bebhuvan.com/wp-content/uploads/2022/05/Emerging-markets-vulnerable-to-rising-US-interest-rates-289x300.png 289w" sizes="auto, (max-width: 640px) 100vw, 640px" />
</li>
<li class="wp-block-jetpack-slideshow_slide swiper-slide">
<img loading="lazy" decoding="async" width="1024" height="885" alt="" class="wp-block-jetpack-slideshow_image wp-image-280" data-id="280" src="https://www.bebhuvan.com/wp-content/uploads/2022/05/Emerging-markets-vulnerable-to-Ukraine-1024x885.jpg" srcset="https://www.bebhuvan.com/wp-content/uploads/2022/05/Emerging-markets-vulnerable-to-Ukraine-1024x885.jpg 1024w, https://www.bebhuvan.com/wp-content/uploads/2022/05/Emerging-markets-vulnerable-to-Ukraine-300x259.jpg 300w, https://www.bebhuvan.com/wp-content/uploads/2022/05/Emerging-markets-vulnerable-to-Ukraine-768x664.jpg 768w, https://www.bebhuvan.com/wp-content/uploads/2022/05/Emerging-markets-vulnerable-to-Ukraine.jpg 1280w" sizes="auto, (max-width: 1024px) 100vw, 1024px" />
</li>
</ul>
<a class="wp-block-jetpack-slideshow_button-prev swiper-button-prev swiper-button-white" role="button"></a><a class="wp-block-jetpack-slideshow_button-next swiper-button-next swiper-button-white" role="button"></a><a aria-label="Pause Slideshow" class="wp-block-jetpack-slideshow_button-pause" role="button"></a>
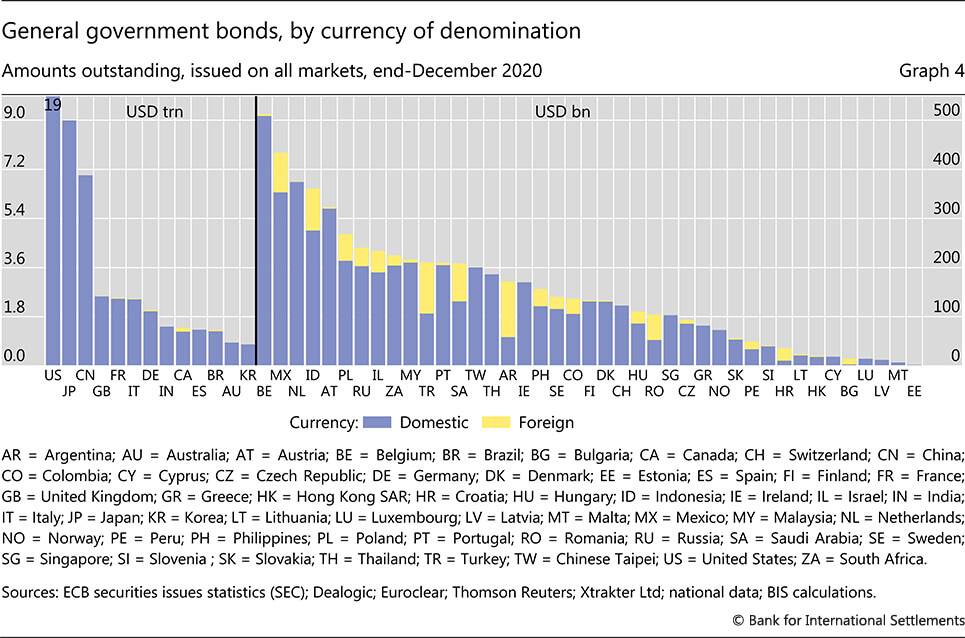
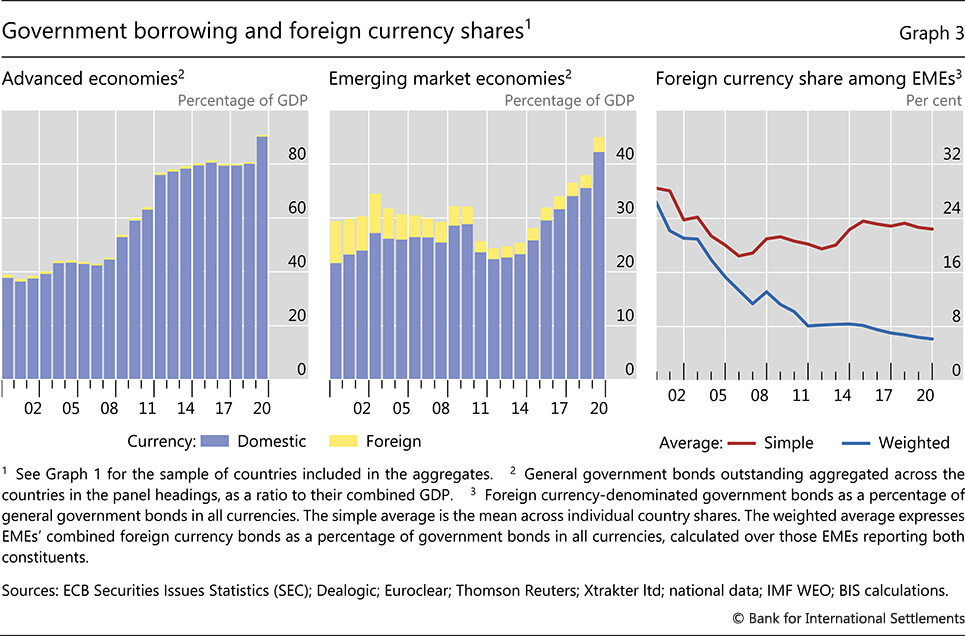
The other perennial worry for emerging market watchers is foreign currency-denominated debt. After all, dollar-denominated debt was at the heart of the Latin American and Asian financial crises. It was dubbed the “original sin.” Since the crises, most emerging markets have developed local currency bond markets. Foreign currency borrowing has reduced significantly.
<ul class="wp-block-jetpack-slideshow_swiper-wrapper swiper-wrapper">
<li class="wp-block-jetpack-slideshow_slide swiper-slide">
<img loading="lazy" decoding="async" width="965" height="638" alt="" class="wp-block-jetpack-slideshow_image wp-image-286" data-id="286" src="https://www.bebhuvan.com/wp-content/uploads/2022/05/Foreign-currency-borrwing-emerging-markets-by-country.jpg" srcset="https://www.bebhuvan.com/wp-content/uploads/2022/05/Foreign-currency-borrwing-emerging-markets-by-country.jpg 965w, https://www.bebhuvan.com/wp-content/uploads/2022/05/Foreign-currency-borrwing-emerging-markets-by-country-300x198.jpg 300w, https://www.bebhuvan.com/wp-content/uploads/2022/05/Foreign-currency-borrwing-emerging-markets-by-country-768x508.jpg 768w" sizes="auto, (max-width: 965px) 100vw, 965px" />
</li>
<li class="wp-block-jetpack-slideshow_slide swiper-slide">
<img loading="lazy" decoding="async" width="965" height="636" alt="" class="wp-block-jetpack-slideshow_image wp-image-287" data-id="287" src="https://www.bebhuvan.com/wp-content/uploads/2022/05/Foreign-currency-borrwing-emerging-markets.jpg" srcset="https://www.bebhuvan.com/wp-content/uploads/2022/05/Foreign-currency-borrwing-emerging-markets.jpg 965w, https://www.bebhuvan.com/wp-content/uploads/2022/05/Foreign-currency-borrwing-emerging-markets-300x198.jpg 300w, https://www.bebhuvan.com/wp-content/uploads/2022/05/Foreign-currency-borrwing-emerging-markets-768x506.jpg 768w" sizes="auto, (max-width: 965px) 100vw, 965px" />
</li>
</ul>
<a class="wp-block-jetpack-slideshow_button-prev swiper-button-prev swiper-button-white" role="button"></a><a class="wp-block-jetpack-slideshow_button-next swiper-button-next swiper-button-white" role="button"></a><a aria-label="Pause Slideshow" class="wp-block-jetpack-slideshow_button-pause" role="button"></a>
Just about 26% of the emerging market debt is denominated in foreign currency, mostly US dollars. Countries like Argentina, Turkey, Mexico, and Columbia are the notable exceptions. Though EMs started borrowing in local currency, they still had to rely on foreign investors to buy the debt given their small domestic investor base. As a result, foreign investors hold about 25% of the local currency sovereign debt.
This didn’t eliminate the original sin, it just shifted the risk from borrowers to lenders. Foreign investors have to worry about the appreciation and depreciation of emerging market currencies. If the currency appreciates, it increases the value of emerging market debt investments and flows increase. But if the currency depreciates, it lowers the value of their investments, forcing these investors to sell, leading to outflows and widening spreads. This selling creates a feedback loop of further selling due to portfolio limits, risk limits, and further widening of spreads1,2,3.
Sovereign piggybanks
The other risk is the substantial increase in sovereign bond holdings by the emerging market banks post COVID-19. This was highlighted in the IMF’s recent Global Financial Stability Report.
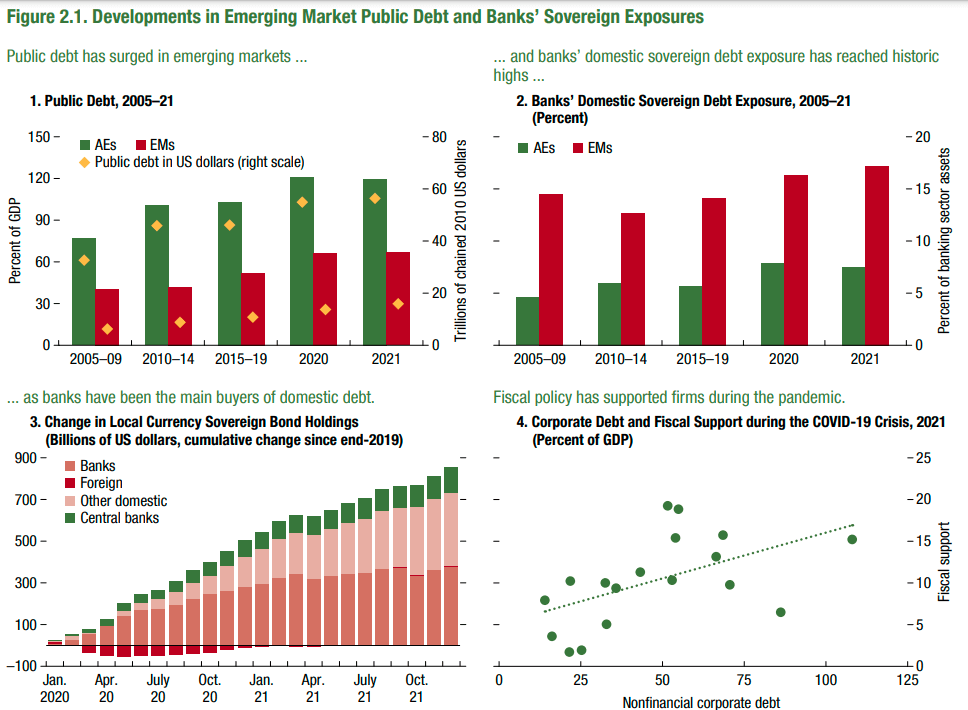
Banks have financed a large part of the pandemic deficit spending by emerging market countries. Bank holding of sovereign debt is highest among countries with higher debt-to-GDP ratios. The worry is that this link between sovereigns and banks could become a problem if growth slows. Slowing growth could lead to widening sovereign spreads, increased govt borrowing costs, losses for banks holding the bonds, higher financing conditions for corporates and other macroeconomic spillovers.
Sovereign payday lender
The other issue is the fact that China is now the biggest lender to many small countries across Asia and Africa. It has overtaken the IMF, World Bank and the Paris Club as the largest creditor to nations. The exact numbers are anybody’s guess, but some estimates put total Chinese lending between $100 and-200 billion.This difficulty in assessing the true scale of Chinese lending is due to the confidentiality clauses in the debt agreements.
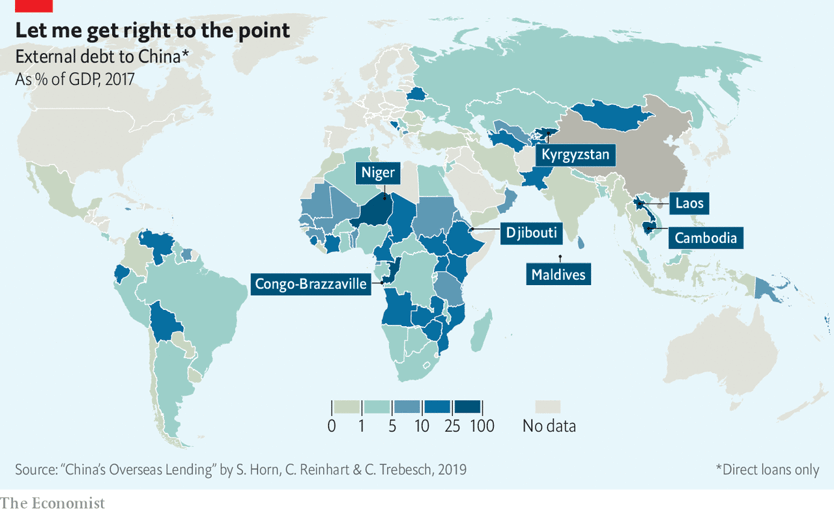
Given the scale of lending, It has been accused of debt diplomacy—a honey trap for countries by offering cheap and concessional loans. Some studies even estimate that there might be unreported debts of around $385 billion, given the lack of transparency. China has come under increasing criticism and has been blamed for the recent default in Sri Lanka. But not everyone agrees with the notion that China is entrapping countries through debt1,2.
Since a lot of these loans are unreported, it’s very hard to estimate the exact scale of indebtedness in low income and poor countries. Carmen Reinhart et al. estimate that 60% of Chinese credit is to countries already in distress. They also note that these debts have led to a wave of unreported debt restructurings, and very little is known about them. If these estimates are even half true, the poorest countries are in serious trouble. Having said that, a small silver lining is that China hasn’t yet started seizing collateral and taking over countries as many predicted. But if you now add rising rates to this cocktail of troubles, things can escalate very quickly in countries already under debt distress.
The exact fallout from Chinese lending is anybody’s guess. The worry is that this changing composition of creditors could complicate debt resolutions in case of sovereign defaults. The hope is that China won’t risk ruing its reputation by being aggressive in recovering what it’s owed, but at this point, hope is all it is.
Bottom line
The bottom line is emerging markets have changed a lot since the Asian and Latin American crises. A lot of these countries, especially the Asian economies, have implemented serious reforms. Barring a few small countries, foreign currency borrowing accounts for a very small share of the total emerging market debt. Emerging markets have also built up a significant amount of foreign currency reserves.
Instead of a debt crisis, emerging markets may suffer various degrees of “fiscal scarring”
The probability of a repeat of an 80s and 90s type of crisis is very slim. Having said that, the poorest countries like Pakistan, Egypt, Tunisia, Mozambique, and Rwanda have seen a sizable increase in debt burdens. The rising food and energy prices will make things worse at a time when they are already at a high risk of defaults. It looks like the wave of defaults in poor countries might just be starting. Zambia defaulted in 2020 and Sri Lanka this year. Nepal seems to be in the same situation as Sri Lanka.
As longtime EM observer David Lubin wrote last year:
Low-income and lower-middle-income countries have indeed seen an increase in their net external debt, denominated in foreign exchange, and in their debt service ratios during the past 10 years. But understood in a longer historical context, these indicators of debt-carrying capacity are still quite healthy compared to 20 or 30 years ago when debt problems really were acute.
Tobias Adrain of the IMF:
“There are certainly many countries that are either already in distress or will potentially be in distress in the near future,” he said in an interview with the Financial Times. The IMF on Tuesday cut its forecast for growth in emerging markets and developing economies to 3.8 per cent this year — down one percentage point from its January estimate.
“At some point, some major emerging market could also come into distress and the picture could change . . . That is not in our baseline right now, but it depends on how adverse the evolution of financial sector shocks is going to be,” Adrian added, noting that the amount of debt at risk is not “systemic in nature at this point”.
Weekly Update from IIF:
– EM debt amount is at $95 trillions, up $8Tr in 2021 and higher than DMs, mainly driven by China – Average Debt to Gdp is around 65% – Limited contagion risks, except Turkey – Russia reduced debt-GDP notably, yet Corporate debt level is still high pic.twitter.com/RCemhcJELV
— serkanerden_eng (@SerkanErden_Eng)
<a href="https://twitter.com/SerkanErden_Eng/status/1497188489011601439?ref_src=twsrc%5Etfw">February 25, 2022</a>
But, for the countries that do default, debt resolution will be a nightmare. After the pandemic hit, the IMF, G20 and other institutions announced a series of debt service suspension initiatives for low-income countries. The debt wasn’t cancelled, just postponed, and it’ll start coming due in the next couple of years, and this is where the issue is. If there are defaults, restructuring these debts won’t be as easy as pre-2008 because of the diverse creditor base
Karina Patricio Ferreira Lima wrote a prescient piece in 2020 explaining how notorious hard sovereign debt restructurings are. Unlike corporate bankruptcies, there’s no international body for sovereign defaults. The problem is that the sovereign creditor base has changed. A few decades ago it was mostly the Paris Club lenders, banks and multilateral institutions like the IMF and World Bank. But today you have a complex mix of multilateral institutions, bilateral lenders and bondholders.
This working paper by <a href="https://twitter.com/davidmihalyi?ref_src=twsrc%5Etfw">@davidmihalyi</a> and <a href="https://twitter.com/Ch_Trebesch?ref_src=twsrc%5Etfw">@Ch_Trebesch</a> is really helpful to understand the debt profile and creditor composition of sovereign debt in Africa. This graph in particular puts into context current narratives about the so-called Chinese debt trap.<a href="https://t.co/ESq8VD0xhw">https://t.co/ESq8VD0xhw</a> <a href="https://t.co/5WCCgqJe3X">pic.twitter.com/5WCCgqJe3X</a>
— Karina Patrício (@KPatricio_)
<a href="https://twitter.com/KPatricio_/status/1518911396024623104?ref_src=twsrc%5Etfw">April 26, 2022</a>
Diverse creditors and competing agendas make sovereign debt resolutions incredibly hard and messy. Then there’s the nuisance of vulture hedge funds like Paul Singer’s Elliot Capital, whose sole job is to extract the maximum they can from sovereign creditors. This messy reality will just make life miserable for these poor and low-income countries in the event of a default.
In any case, the DSSI will likely postpone the sovereign insolvency crisis of eligible states, rather than resolve it. The payments to official creditors frozen by the G20 will all come due between 2022 and 2024, along with the accrued interest. In the meantime, without private sector involvement, the G20’s standstill and multilateral funding may divert resources necessary for recovery to the repayment of private debt.
This varied creditor base of sovereign debt includes many competing interests and few shared codes of conduct. It is now much trickier to coordinate behind closed doors through the sort of “gentlemen’s agreements“ which <a rel="noreferrer noopener" href="https://progressive.international/blueprint/ff74a0da-6171-4d68-877e-6e7377e33692-alexander-kentikelenis-against-the-gentlemans-agreement/en" target="_blank">permitted</a> restructuring in the past. Furthermore, the <a rel="noreferrer noopener" href="https://www.ft.com/content/f7157356-e773-47c4-b05d-8624a5ccfd03" target="_blank">level</a> of exposure of hedge funds to emerging market bonds indicates that holdout strategies may become more widespread than in previous crises and include not only high-risk hedge funds (also known as “vulture funds”) but also traditional ones. In this context, consensus is much harder to achieve than in the past.
— Karina Patricio Ferreira Lima
Emerging market corporate debt crisis
It’s the same worry when it comes to emerging market dollar-denominated corporate borrowing. People worry about the high corporate debt to GDP ratio in emerging markets. But there’s nuance required here. According to BIS data, there’s about $4.2 trillion of non-financial dollar debt in emerging markets. Sure, that sounds scary but emerging market central banks have built up substantial reserves to the tune of $6-7 trillion.
Even though corporate debt increased from 56 to 96% of GDP in emerging markets between 2008 and 2018, most of it was in local currency bonds. This mitigates the issue of a strengthening dollar to an extent. The US Federal Reserve conducted a stress test on emerging economies with 3 variables: falling earnings, rising interest rates and currency depreciation. The analysis found that falling earnings and rising interest rates would be the most disruptive:
In particular, the authors assume a fall in earnings of 20 percent, a rise of 100 basis points in the interest rate paid by firms, and a 20 percent depreciation of the exchange rate. This study finds that if the three shocks would occur simultaneously, the debt-at-risk in emerging economies in 2016 would rise from 25 to 41 percent. Excluding China, debt-at-risk would increase from 15 to 34 percent.
Although high, these values would still be below those on the eve of the AFC when debt-at-risk stood at 48 percent. Nevertheless, in several large emerging economies the share of debt-at-risk would get near or, even, surpass 48 percent. This would be the case of Indonesia (62 percent), Mexico (53 percent), China (48 percent), and Brazil (45 percent). In other words, in major emerging economies about half of nonfinancial corporate debt would correspond to firms with weak debt servicing capacity. According to this Federal Reserve study, shocks to earnings and interest rates would be the most harmful.
— Growth of Global Corporate Debt : Main Facts and Policy Challenges
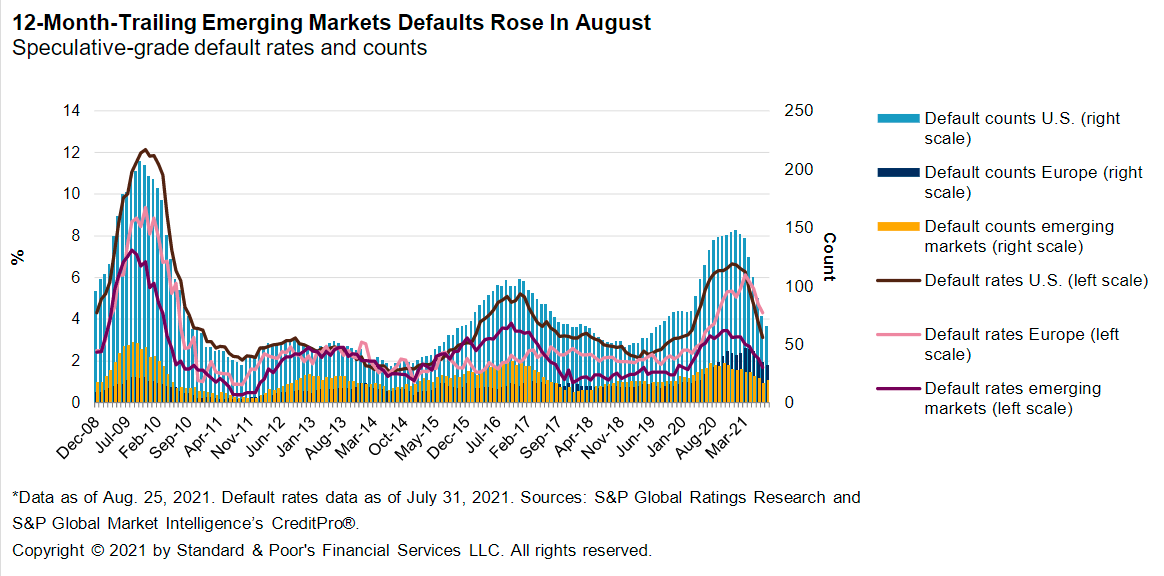
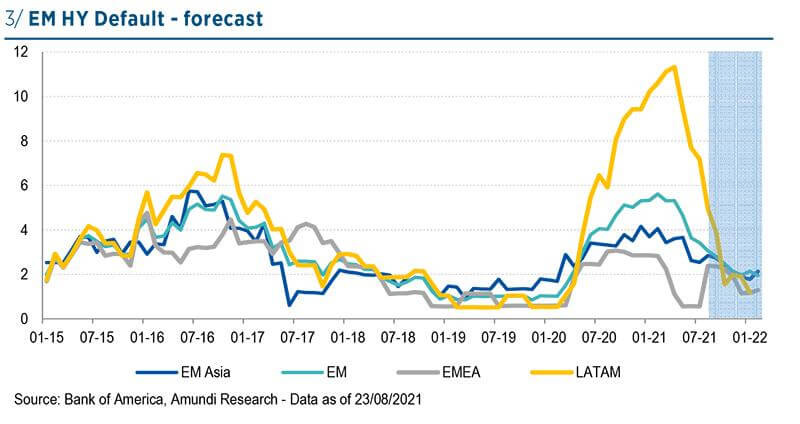
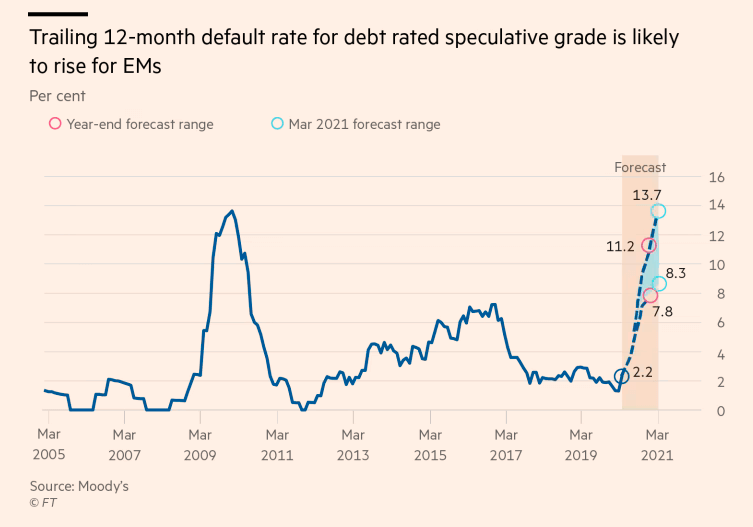
But so far, corporate default rates have remained low. In fact, they are lower than the US high and speculative yield default rates.
<ul class="wp-block-jetpack-slideshow_swiper-wrapper swiper-wrapper">
<li class="wp-block-jetpack-slideshow_slide swiper-slide">
<img loading="lazy" decoding="async" width="1024" height="507" alt="" class="wp-block-jetpack-slideshow_image wp-image-290" data-id="290" src="https://www.bebhuvan.com/wp-content/uploads/2022/05/EM-default-rates-SP.jpg-1024x507.png" srcset="https://www.bebhuvan.com/wp-content/uploads/2022/05/EM-default-rates-SP.jpg-1024x507.png 1024w, https://www.bebhuvan.com/wp-content/uploads/2022/05/EM-default-rates-SP.jpg-300x148.png 300w, https://www.bebhuvan.com/wp-content/uploads/2022/05/EM-default-rates-SP.jpg-768x380.png 768w, https://www.bebhuvan.com/wp-content/uploads/2022/05/EM-default-rates-SP.jpg.png 1164w" sizes="auto, (max-width: 1024px) 100vw, 1024px" />
</li>
<li class="wp-block-jetpack-slideshow_slide swiper-slide">
<img loading="lazy" decoding="async" width="800" height="424" alt="" class="wp-block-jetpack-slideshow_image wp-image-291" data-id="291" src="https://www.bebhuvan.com/wp-content/uploads/2022/05/EM-default-rates.jpg" srcset="https://www.bebhuvan.com/wp-content/uploads/2022/05/EM-default-rates.jpg 800w, https://www.bebhuvan.com/wp-content/uploads/2022/05/EM-default-rates-300x159.jpg 300w, https://www.bebhuvan.com/wp-content/uploads/2022/05/EM-default-rates-768x407.jpg 768w" sizes="auto, (max-width: 800px) 100vw, 800px" />
</li>
<li class="wp-block-jetpack-slideshow_slide swiper-slide">
<img loading="lazy" decoding="async" width="753" height="527" alt="" class="wp-block-jetpack-slideshow_image wp-image-292" data-id="292" src="https://www.bebhuvan.com/wp-content/uploads/2022/05/EM-speculative-default-rate.png" srcset="https://www.bebhuvan.com/wp-content/uploads/2022/05/EM-speculative-default-rate.png 753w, https://www.bebhuvan.com/wp-content/uploads/2022/05/EM-speculative-default-rate-300x210.png 300w" sizes="auto, (max-width: 753px) 100vw, 753px" />
</li>
</ul>
<a class="wp-block-jetpack-slideshow_button-prev swiper-button-prev swiper-button-white" role="button"></a><a class="wp-block-jetpack-slideshow_button-next swiper-button-next swiper-button-white" role="button"></a><a aria-label="Pause Slideshow" class="wp-block-jetpack-slideshow_button-pause" role="button"></a>
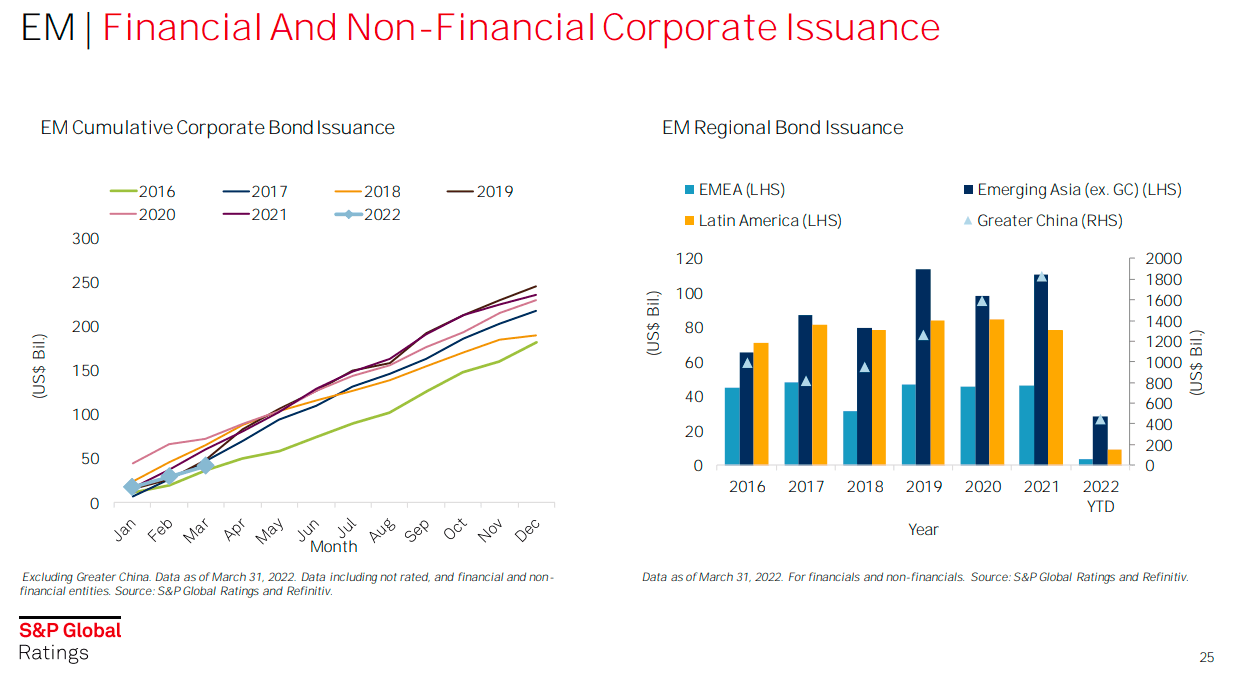
The reason for concerns over emerging market corporate debt is because of the pace at which it has grown since 2008 and the COVID-19 shock to corporate balance sheets.
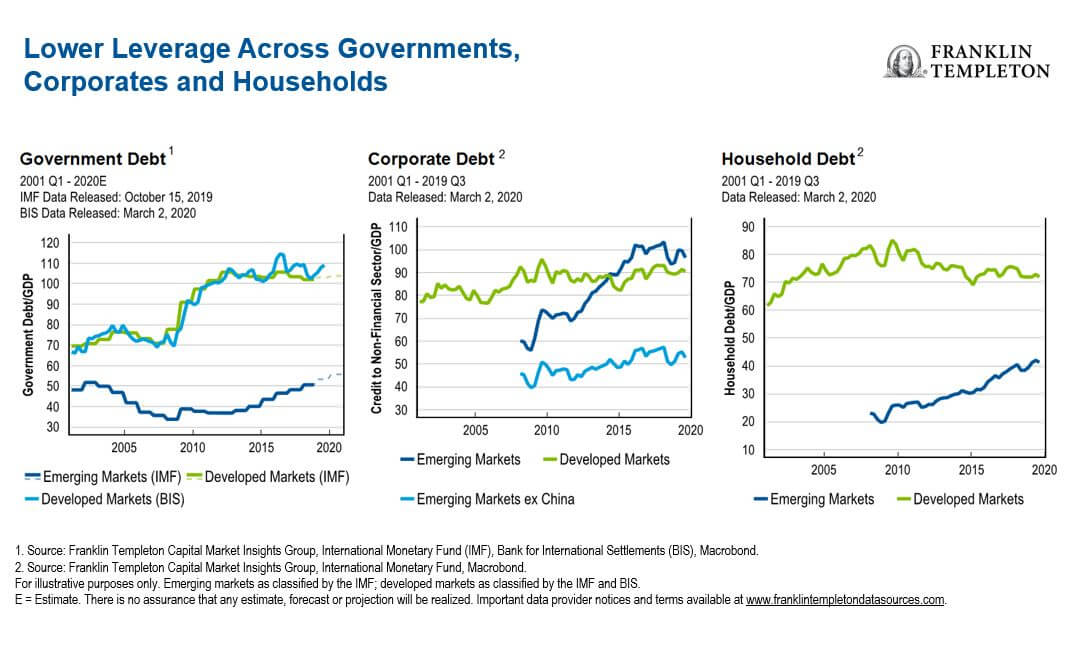
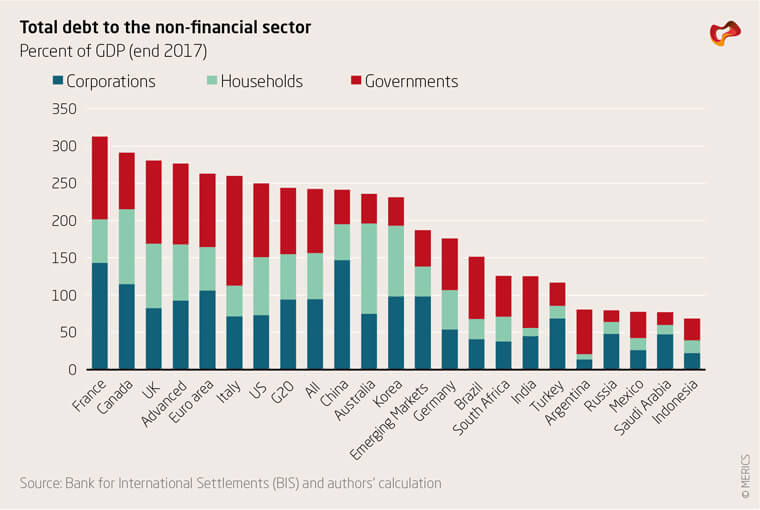
But much of that growth is due to the stunning growth of debt levels in China. Corporate debt in China has grown faster than all the other EMs combined—madness!
<ul class="wp-block-jetpack-slideshow_swiper-wrapper swiper-wrapper">
<li class="wp-block-jetpack-slideshow_slide swiper-slide">
<img loading="lazy" decoding="async" width="1024" height="556" alt="" class="wp-block-jetpack-slideshow_image wp-image-295" data-id="295" src="https://www.bebhuvan.com/wp-content/uploads/2022/05/Emerging-market-financial-and-non-financial-debt-by-ratings.jpg-1-1024x556.png" srcset="https://www.bebhuvan.com/wp-content/uploads/2022/05/Emerging-market-financial-and-non-financial-debt-by-ratings.jpg-1-1024x556.png 1024w, https://www.bebhuvan.com/wp-content/uploads/2022/05/Emerging-market-financial-and-non-financial-debt-by-ratings.jpg-1-300x163.png 300w, https://www.bebhuvan.com/wp-content/uploads/2022/05/Emerging-market-financial-and-non-financial-debt-by-ratings.jpg-1-768x417.png 768w, https://www.bebhuvan.com/wp-content/uploads/2022/05/Emerging-market-financial-and-non-financial-debt-by-ratings.jpg-1.png 1246w" sizes="auto, (max-width: 1024px) 100vw, 1024px" />
</li>
<li class="wp-block-jetpack-slideshow_slide swiper-slide">
<img loading="lazy" decoding="async" width="760" height="510" alt="" class="wp-block-jetpack-slideshow_image wp-image-296" data-id="296" src="https://www.bebhuvan.com/wp-content/uploads/2022/05/total-debt-to-non-financial-sector.jpg" srcset="https://www.bebhuvan.com/wp-content/uploads/2022/05/total-debt-to-non-financial-sector.jpg 760w, https://www.bebhuvan.com/wp-content/uploads/2022/05/total-debt-to-non-financial-sector-300x201.jpg 300w" sizes="auto, (max-width: 760px) 100vw, 760px" />
</li>
</ul>
<a class="wp-block-jetpack-slideshow_button-prev swiper-button-prev swiper-button-white" role="button"></a><a class="wp-block-jetpack-slideshow_button-next swiper-button-next swiper-button-white" role="button"></a><a aria-label="Pause Slideshow" class="wp-block-jetpack-slideshow_button-pause" role="button"></a>
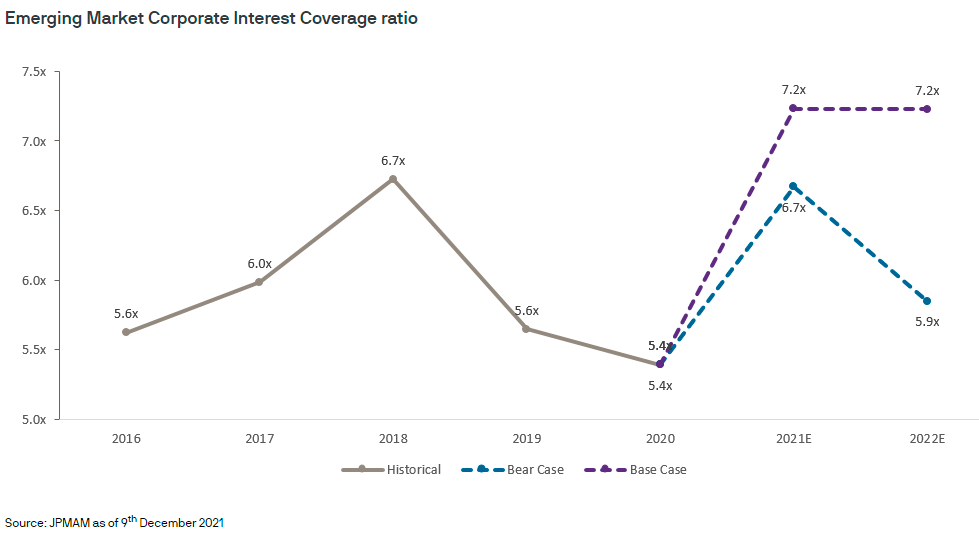
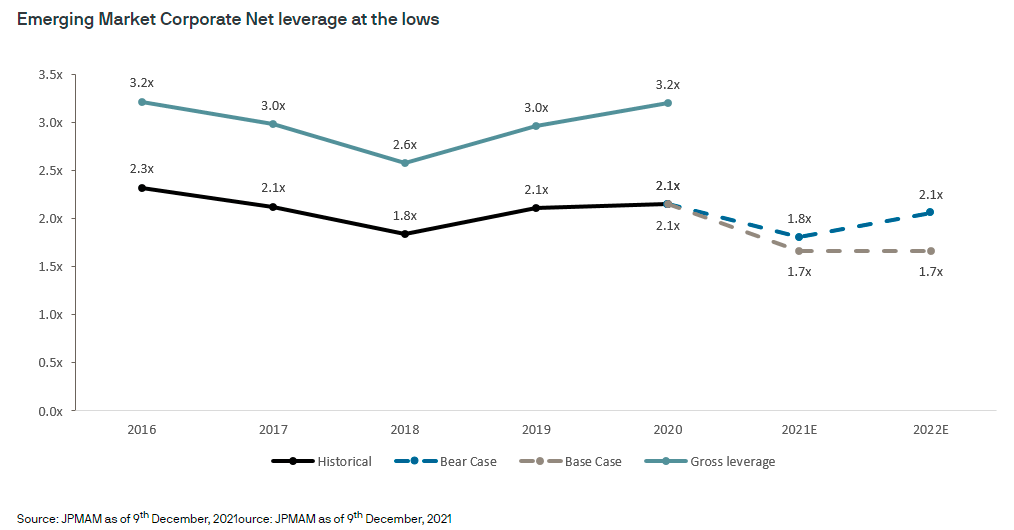
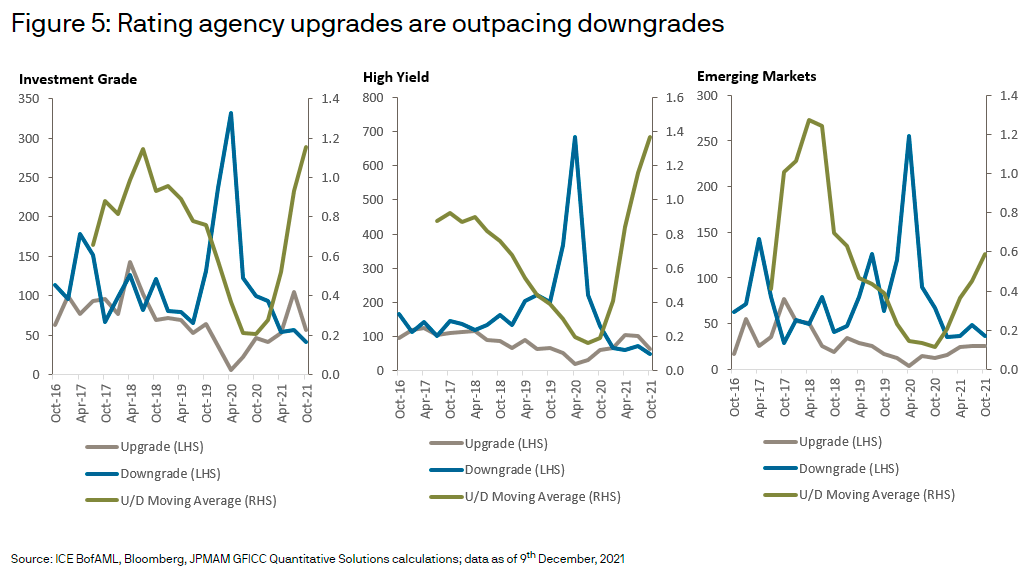
This has been the case since 2008 when China unleashed a massive stimulus that quite literally pulled the entire world from the brink of a great depression. But if you look past the headlines, corporate fundamentals at an aggregate level aren’t apocalyptic.
<ul class="wp-block-jetpack-slideshow_swiper-wrapper swiper-wrapper">
<li class="wp-block-jetpack-slideshow_slide swiper-slide">
<img loading="lazy" decoding="async" width="979" height="533" alt="" class="wp-block-jetpack-slideshow_image wp-image-298" data-id="298" src="https://www.bebhuvan.com/wp-content/uploads/2022/05/Emerging-Market-Corporate-Interest-Coverage-ratio.png" srcset="https://www.bebhuvan.com/wp-content/uploads/2022/05/Emerging-Market-Corporate-Interest-Coverage-ratio.png 979w, https://www.bebhuvan.com/wp-content/uploads/2022/05/Emerging-Market-Corporate-Interest-Coverage-ratio-300x163.png 300w, https://www.bebhuvan.com/wp-content/uploads/2022/05/Emerging-Market-Corporate-Interest-Coverage-ratio-768x418.png 768w" sizes="auto, (max-width: 979px) 100vw, 979px" />
</li>
<li class="wp-block-jetpack-slideshow_slide swiper-slide">
<img loading="lazy" decoding="async" width="1014" height="530" alt="" class="wp-block-jetpack-slideshow_image wp-image-299" data-id="299" src="https://www.bebhuvan.com/wp-content/uploads/2022/05/Net-leverage-EM.png" srcset="https://www.bebhuvan.com/wp-content/uploads/2022/05/Net-leverage-EM.png 1014w, https://www.bebhuvan.com/wp-content/uploads/2022/05/Net-leverage-EM-300x157.png 300w, https://www.bebhuvan.com/wp-content/uploads/2022/05/Net-leverage-EM-768x401.png 768w" sizes="auto, (max-width: 1014px) 100vw, 1014px" />
</li>
<li class="wp-block-jetpack-slideshow_slide swiper-slide">
<img loading="lazy" decoding="async" width="1024" height="573" alt="" class="wp-block-jetpack-slideshow_image wp-image-300" data-id="300" src="https://www.bebhuvan.com/wp-content/uploads/2022/05/Rating-agency-upgrades-1024x573.png" srcset="https://www.bebhuvan.com/wp-content/uploads/2022/05/Rating-agency-upgrades-1024x573.png 1024w, https://www.bebhuvan.com/wp-content/uploads/2022/05/Rating-agency-upgrades-300x168.png 300w, https://www.bebhuvan.com/wp-content/uploads/2022/05/Rating-agency-upgrades-768x430.png 768w, https://www.bebhuvan.com/wp-content/uploads/2022/05/Rating-agency-upgrades.png 1035w" sizes="auto, (max-width: 1024px) 100vw, 1024px" />
</li>
</ul>
<a class="wp-block-jetpack-slideshow_button-prev swiper-button-prev swiper-button-white" role="button"></a><a class="wp-block-jetpack-slideshow_button-next swiper-button-next swiper-button-white" role="button"></a><a aria-label="Pause Slideshow" class="wp-block-jetpack-slideshow_button-pause" role="button"></a>
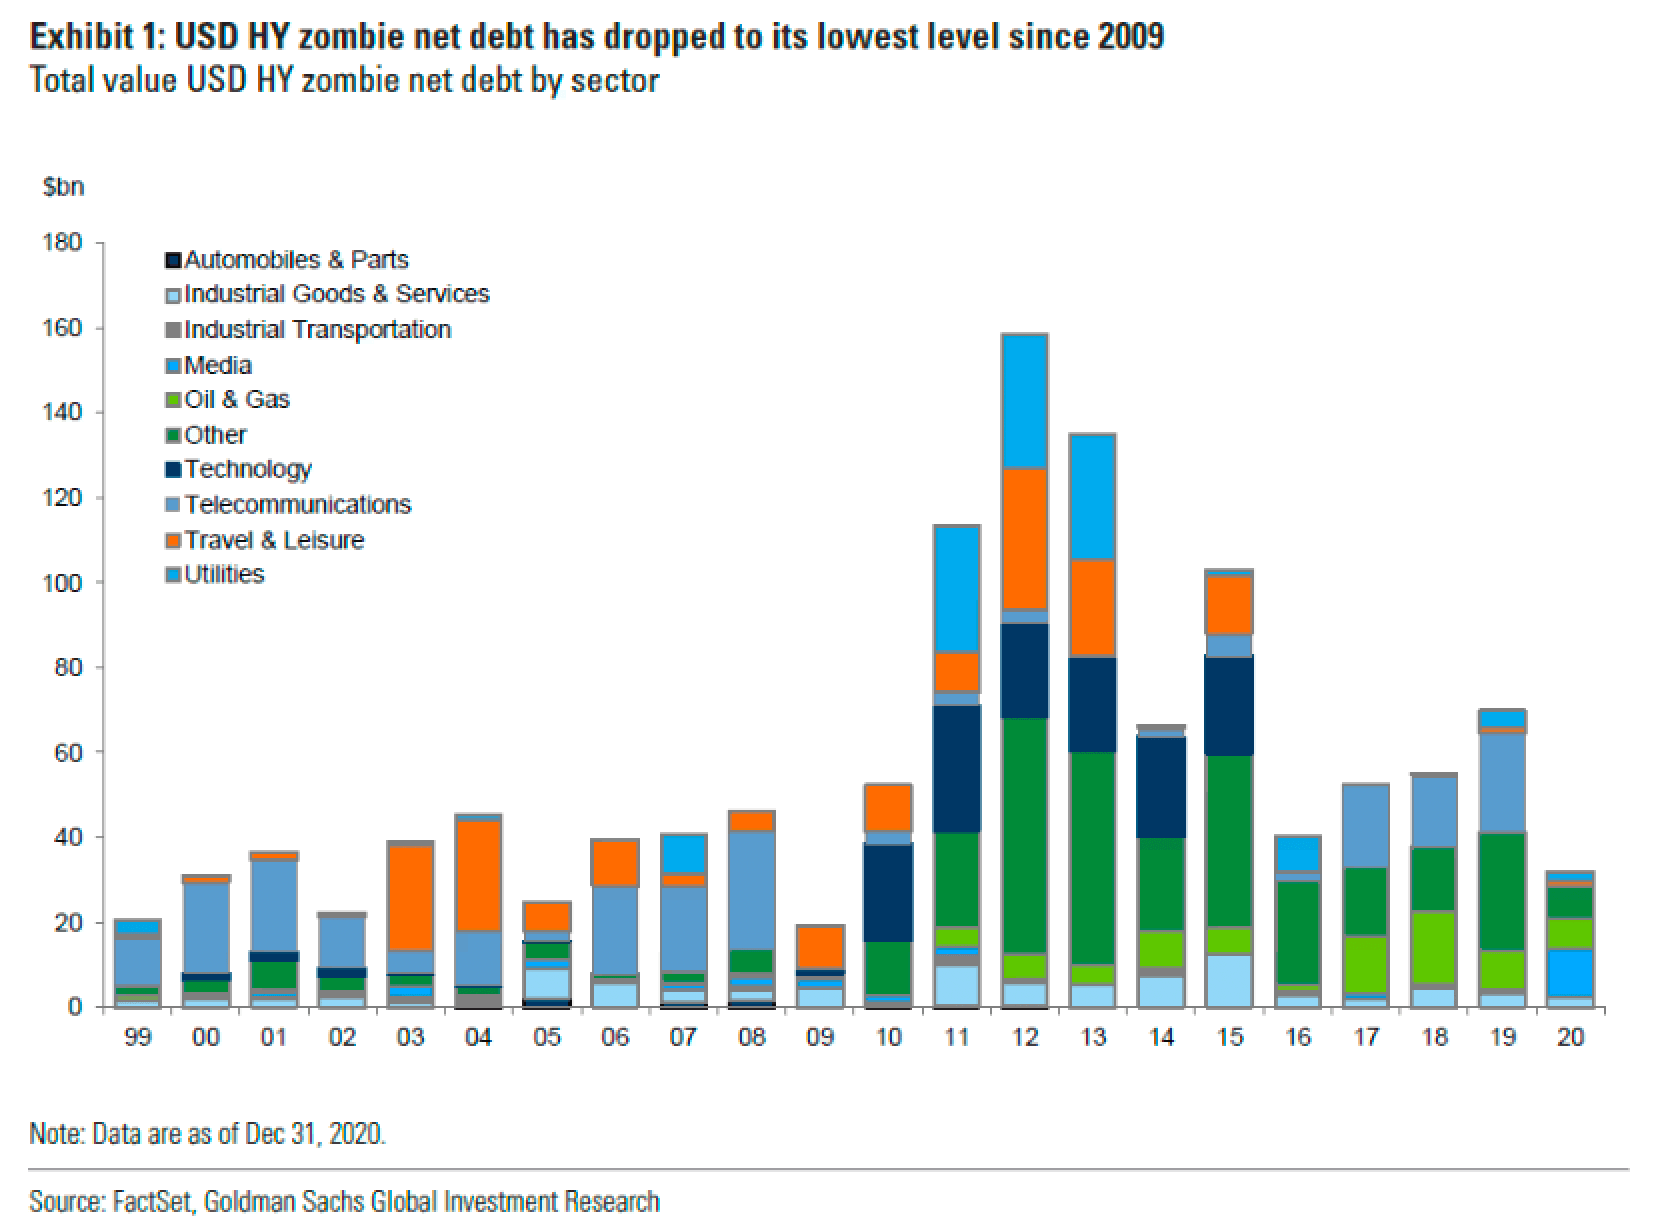
Having said that, not all emerging markets are made the same. Aggregates mask substantial variation among emerging market corporates. But the consensus here is that corporates in China, Latin America and other riskier emerging markets are at the highest risk of defaults. S&P simulated a 300bps interest rate hike and inflation shock on a sample of 24,445 corporates. The results showed that loss-making companies would increase to 7%, double that of last decade. Regionally, Chinese companies would be the most affected.
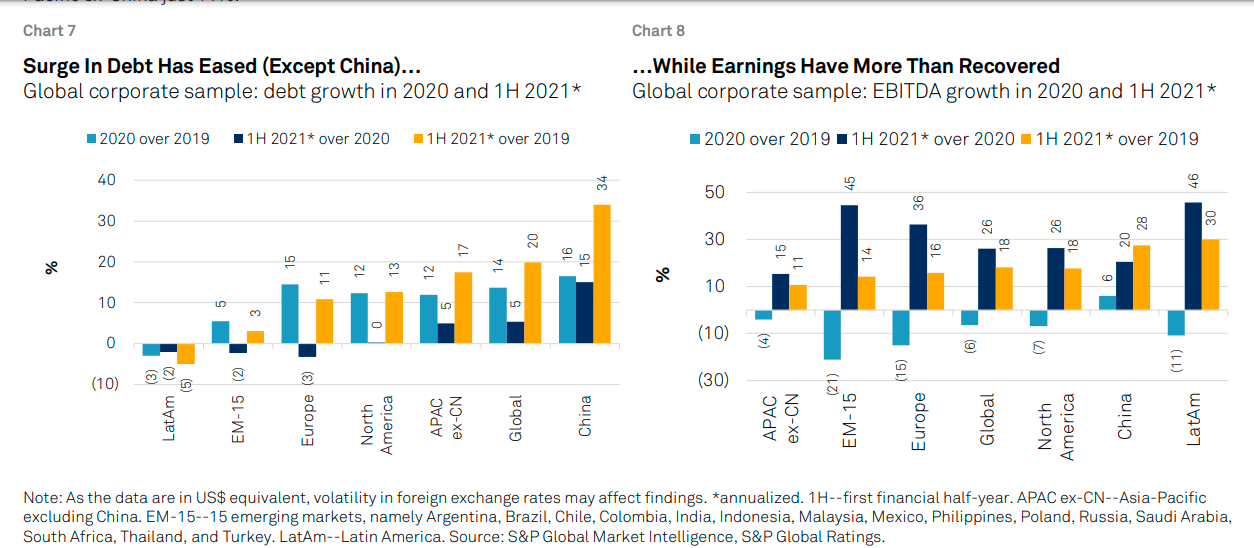
The other perennial worry was over the rise of zombie firms—entities that couldn’t cover their interest payments from their earnings and profits. The argument was that a decade of low interest rates had created a massive horde of undead companies because they were able to raise cheap debt by issuing high yield debt. But that doesn’t seem to be the case, at least in the United States. Zombie companies are being upgraded at twice the rate as they are being downgraded. Of course, not everybody thinks that this will last.
3/ Next year looks like it's going to be even bigger for ratings upgrades, barring a big downturn or something like that. (Chart via Brad Rogoff at Barclays:) <a href="https://t.co/RAML2gf92R">pic.twitter.com/RAML2gf92R</a>
— Tracy Alloway (@tracyalloway)
<a href="https://twitter.com/tracyalloway/status/1452505706263810050?ref_src=twsrc%5Etfw">October 25, 2021</a>
The bottom line is that it’s highly improbable that we are set to witness a wave of corporate bankruptcies in the emerging markets. The highly levered and speculative companies will probably go bankrupt if the Fed aggressively hikes rates. But we are quite some time away from a corporate version of the great depression.
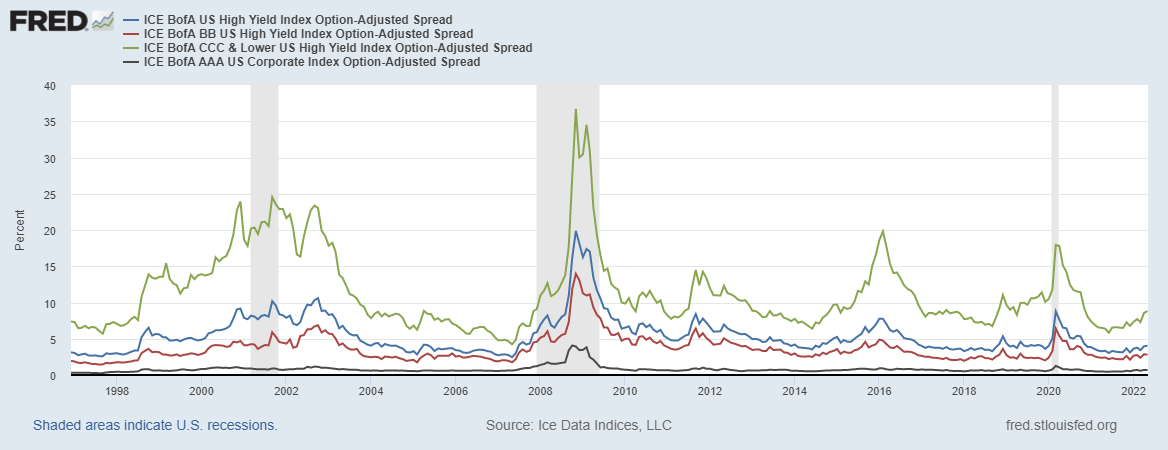
So far, the Fed has hiked by 75 basis points and several EMs started way before the Fed. If you look at emerging market bond spreads, the high yield spreads have shot up quite a bit, almost to the levels seen during the COVID-19 crash. So the most speculative and leveraged companies are at the most risk of default. The broader spreads have largely remained in line with historical averages.
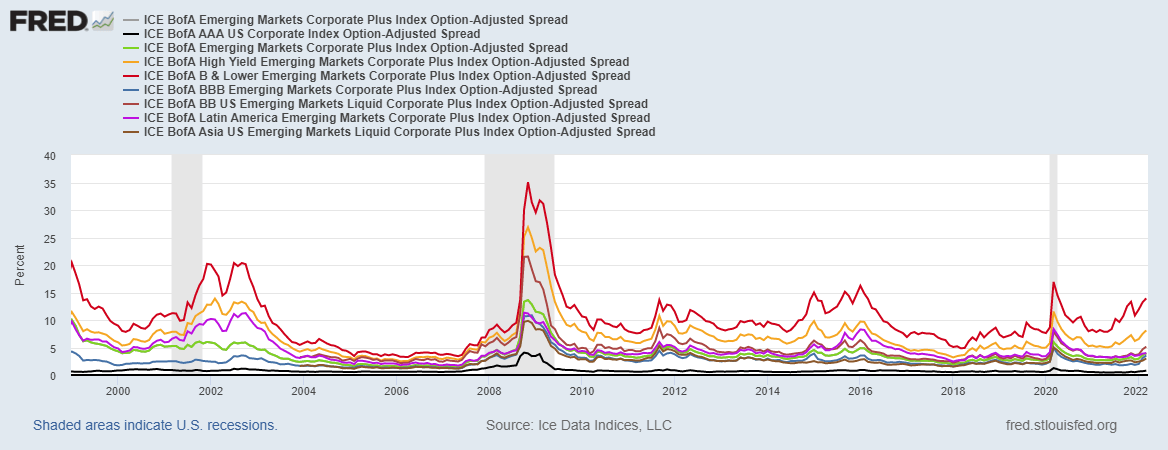
US high yield spreads also haven’t blowout exactly.
Looking broadly at the spreads as based on emerging market dollar-denominated sovereign bond indexes (EMBI) and emerging market dollar-denominated corporate bond indexes (CEMBI) from this UBS report.
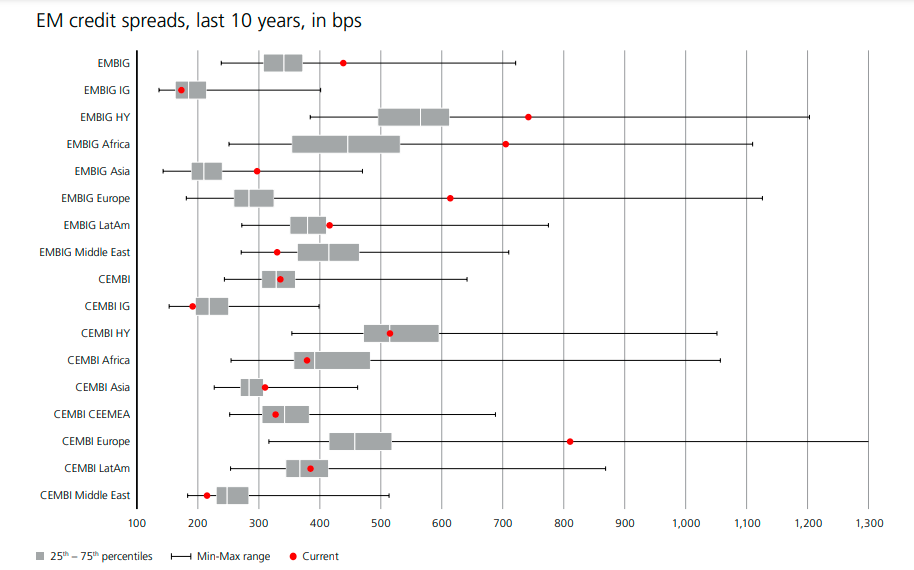
UBS
Emerging markets investing
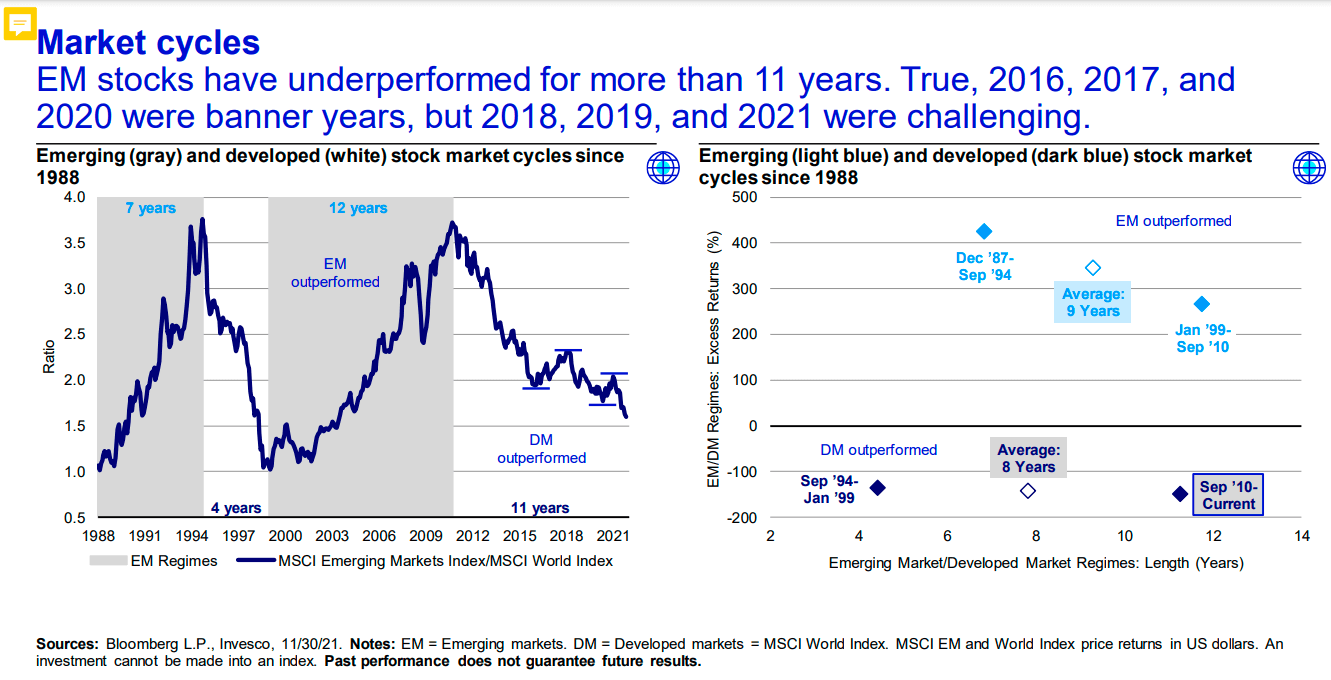
Emerging markets account for 60% of the world GDP. 80%+ of the world’s population lives in emerging markets. They have grown at a faster rate compared to developed economies, the growth premium is 2-3%. Developed markets are ageing and increasingly resemble old-age nursing homes, while emerging markets are full of young people in a playground. These are sales pitches you hear as reasons to invest in emerging markets. Has it worked? Not in a long time. The US has been the undisputed king for well over a decade.
Invesco
Is the cycle turning and will emerging markets make a comeback? It’s not simple. Maybe that’s a topic for another day,